.webp)
%20(1).webp)
Blog
Insights & updates from our experts
Resolve issues quickly with an AI-powered system that automates ticketing.

Resolve issues quickly with an AI-powered system that automates ticketing.

Resolve issues quickly with an AI-powered system that automates ticketing.

Resolve issues quickly with an AI-powered system that automates ticketing.
Resolve issues quickly with an AI-powered system that automates ticketing.

Resolve issues quickly with an AI-powered system that automates ticketing.

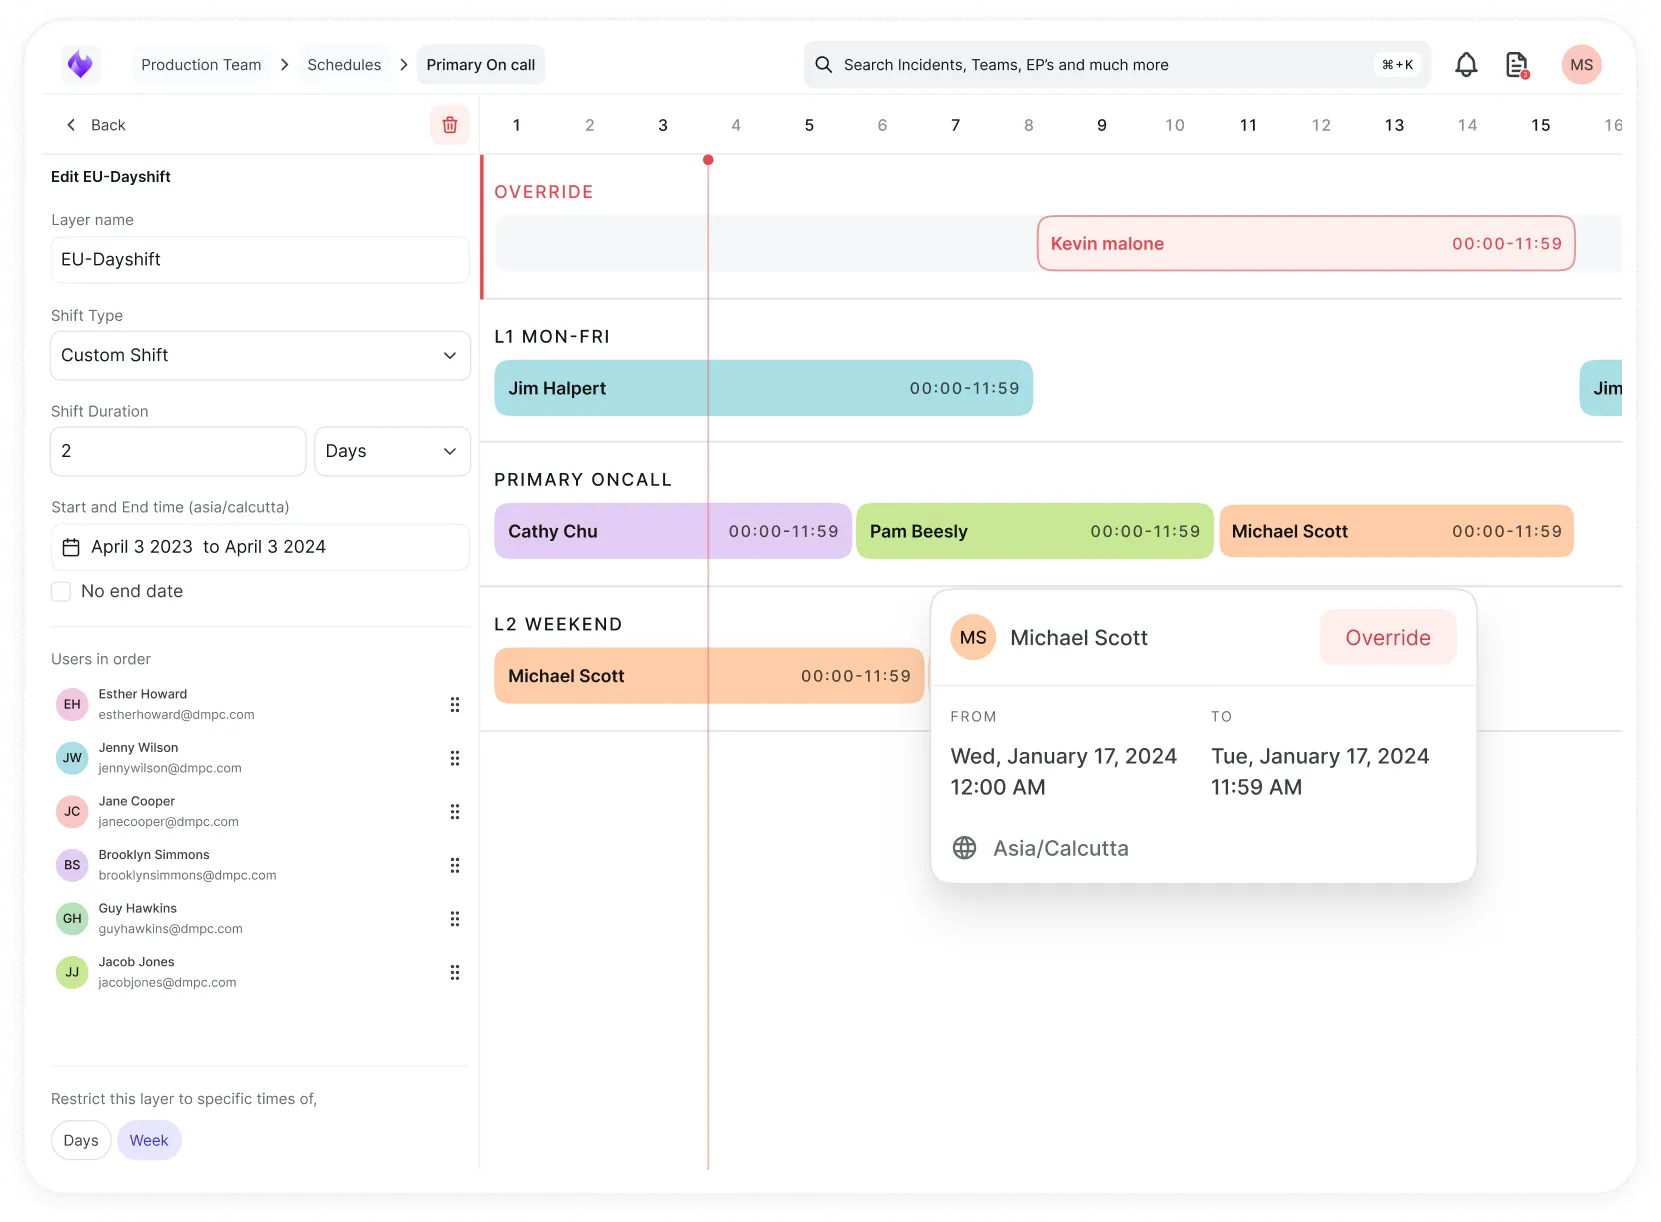
Simplify on-call scheduling, automate escalations, and reduce burnout.
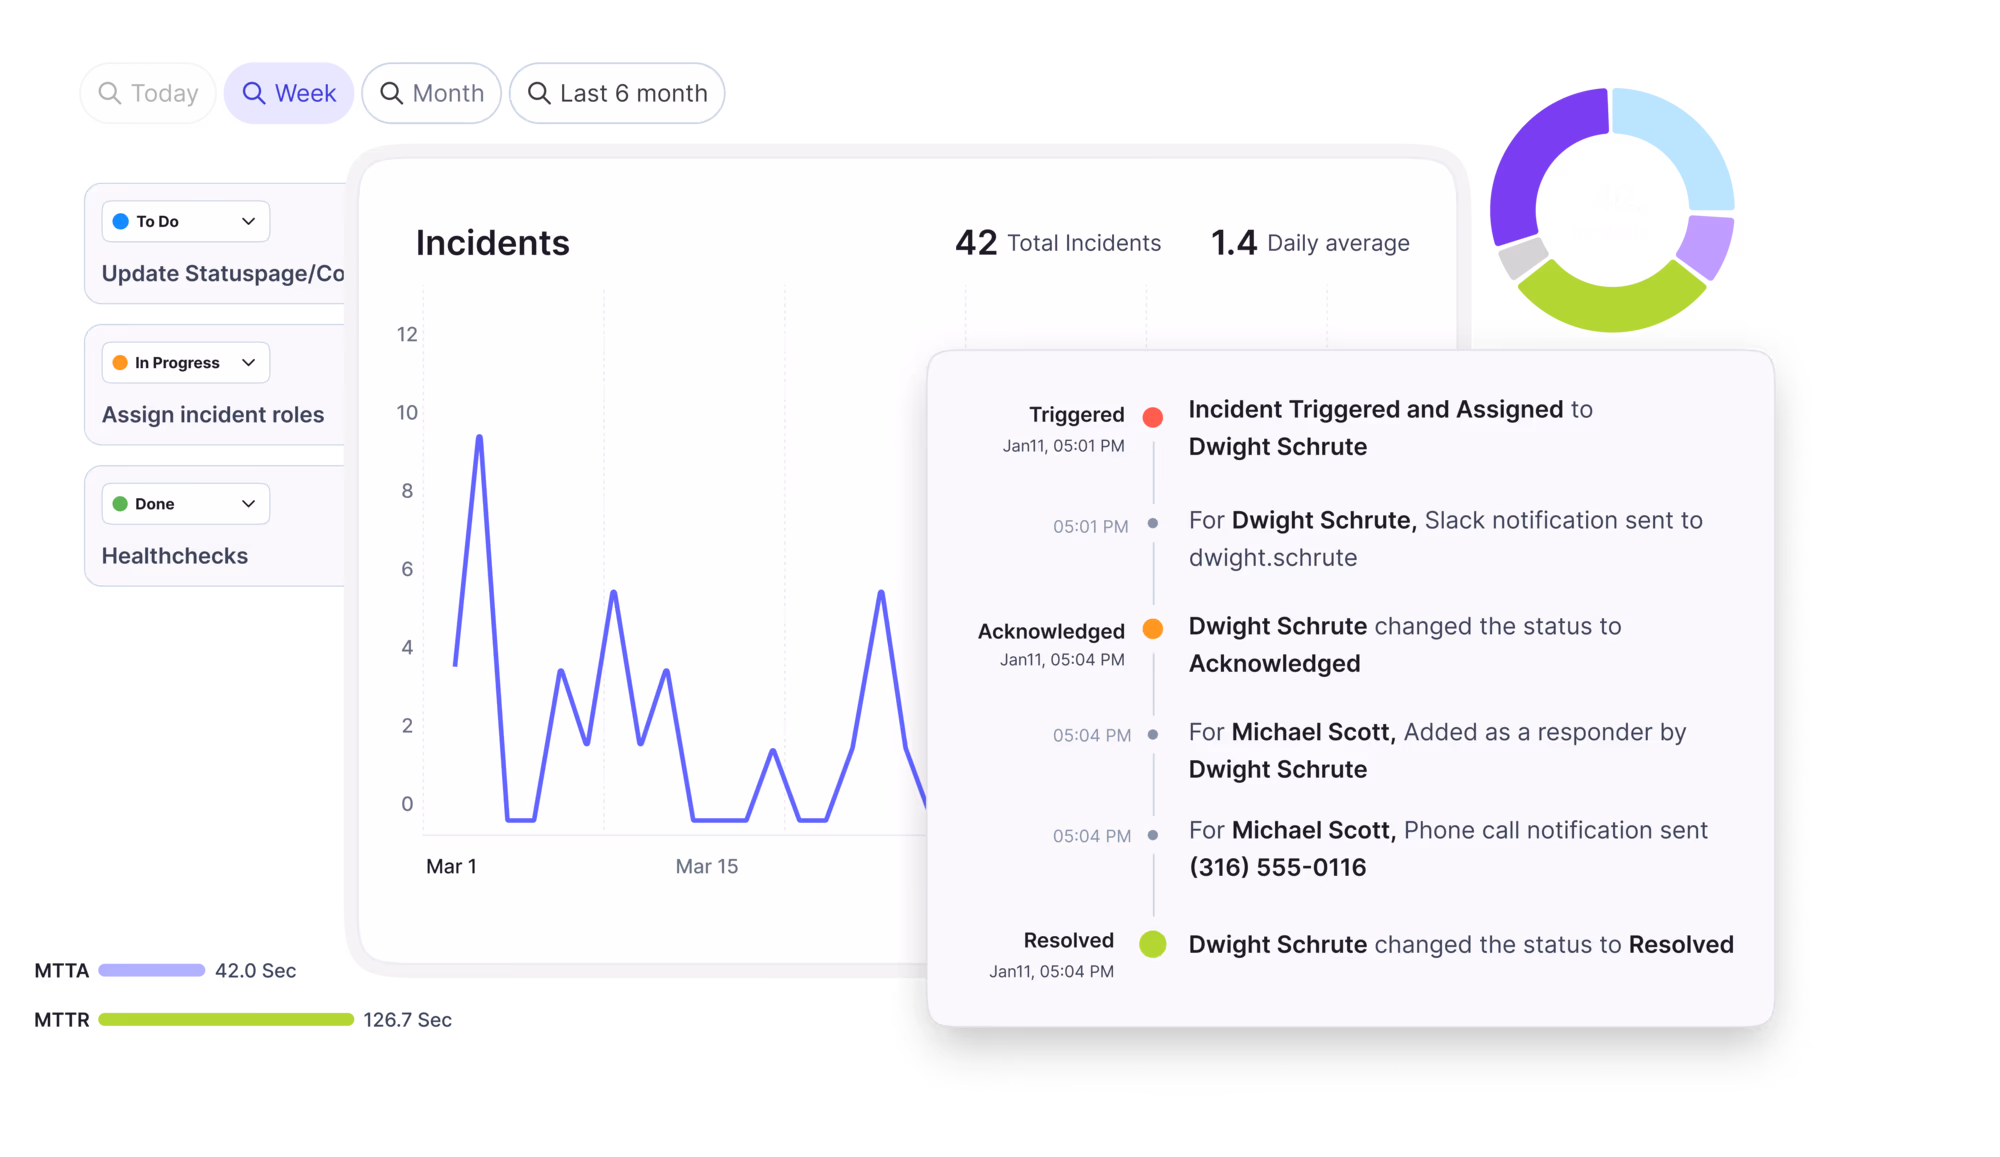
Automate postmortems, AI summaries, and post-incident workflows
We're here to help

The integration with Atlassian Jira using the Xurrent Integration Service is

The integration with Atlassian Jira using the Xurrent Integration Service is

The integration with Atlassian Jira using the Xurrent Integration Service is

The integration with Atlassian Jira using the Xurrent Integration Service is

The integration with Atlassian Jira using the Xurrent Integration Service is

The integration with Atlassian Jira using the Xurrent Integration Service is

The integration with Atlassian Jira using the Xurrent Integration Service is

The integration with Atlassian Jira using the Xurrent Integration Service is
Resolve issues quickly with an AI-powered system that automates ticketing.
Resolve issues quickly with an AI-powered system that automates ticketing.
Simplify on-call scheduling, automate escalations, and reduce burnout.
Automate postmortems, AI summaries, and post-incident workflows
Resolve issues quickly with an AI-powered system that automates ticketing.
Resolve issues quickly with an AI-powered system that automates ticketing.
Resolve issues quickly with an AI-powered system that automates ticketing.
Resolve issues quickly with an AI-powered system that automates ticketing.

We are here to help 24/7

Connect with other Xurrent Users

Get insights and tips on how to get the most out of Xurrent

Apps, APIs, and updates

Xurrent service functionality
Eliminate manual tasks, optimize workflows, and deliver faster resolutions.
Learn how organizations have reduced downtime, improved 50% MTTA & MTTR, and cut costs with Xurrent IMR.
Discover Xurrent IMR's quick support, bidirectional integrations with Jira and Slack, and more cohesive incident response capabilities compared to Opsgenie.
Understand why users value Xurrent IMR for its intuitive interface, efficient incident alerting, customizable On-call schedules, and escalations.


Insights and Updates: Navigating the Future of Service Management
Insights and Updates: Navigating the Future of Service Management

Most IT ops leaders have good data. The problem is the reporting structure built around it—here's how to fix that.
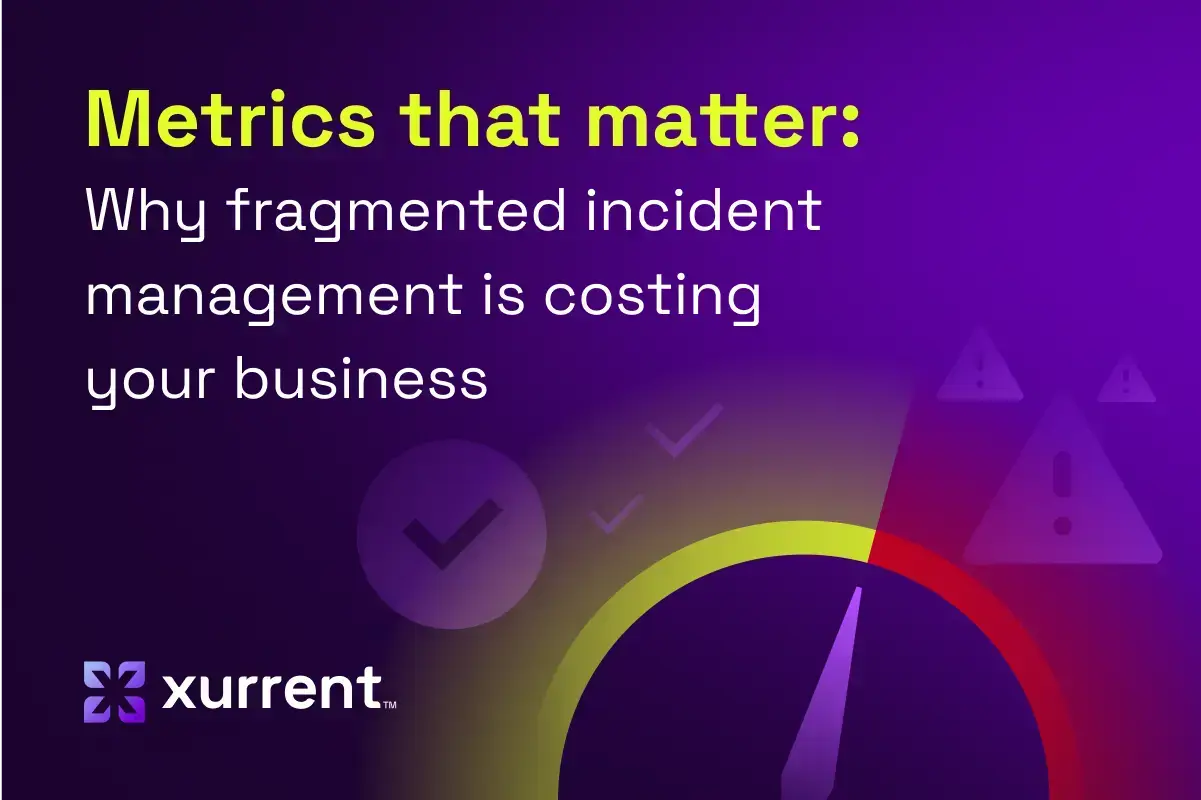
Learn why fragmented incident management metrics create costly measurement gaps and discover the 4 business-aligned metrics that drive real results.

Discover how real-time visibility transforms Enterprise Service Management from reactive IT support to strategic business enablement with measurable outcomes.

Discover why MSPs need to protect their business with modern ITSM solutions. Learn how Xurrent's platform helps reduce the 12% customer churn rate through AI automation, incident management, and customer satisfaction tracking.

We’ve added enhanced functionality to Xurrent with added capability building on the recent StatusCast platform acquisition.
‘Workflows With Completed Requests’ and ‘Requests With Completed Workflows’ added to Data Integrity reports.
It is now made possible for reports in Xurrent to display many (vertical) column charts as a pie chart, or donut chart.
To allow for even more flexibility in designing a dashboard, it is now possible to add rich text fields to it.
Add a description to a specific, filtered report in a dashboard .
A new chart type has now been added, which shows the data of reports in a table view.
Account administrators can now update the intervals of ‘Aging’ reports by clicking the Edit Report button.
The new report: ‘Open Workflows by Phase’ presents the number of workflows where the status is different from 'Completed', grouped by phase.
A ‘Phase’ filter option has been added to all reports that are related to workflows that are not yet completed.
A new report has been added to the ‘Reports’ section of the Analytics console, called ‘Registered Requests by Site’.
Six new reports have now been created, which report on SLAs looking only at the customer (or end-to-end) SLAs.
Four new reports have been added to the ‘Reports’ section of the Analytics console, providing data about the organizations in the account.
Six new reports concerning person records have been added to the ‘Reports’ section of the Analytics console.
A new ‘Template team’ filter has been added to four task-related reports, showing only tasks that were assigned to the team specified in the task template.
A person with the Service level manager role is now also able to share dashboards with customer representatives.
It is now possible to add a description to any of the dashboards of the Analytics console, using the new description field.

Wouter Wyns, Service Management Architect at Xurrent, explains how to slice a watermelon with Xurrent's Service Insight dashboard
Two new reports are available from the Analytics module: ‘Completed Requests by Hour’ and ‘Completed Requests by Day and Hour’.

We interviewed Thomas Fruhstuck, CISO at Xurrent, about the benefits of Xurrent when conducting an audit.
A new filter option is added to places where data could already be filtered by organization: filter by organization including its descendants.
Three new reports that are related to the Activity Monitor have been added to the ‘Reports’ section of the Analytics console.
A new 'Updates' column has now been added to the ‘Current Usage’ view, presenting the number of updates made per user in the current month.
Two metric reports have been added to the ‘Reports’ section of the Analytics console: the ‘Services’ and the ‘Service instances’ report.
It is now possible to create shareable links and QR codes to invite users to fill out a survey or to complete an uncompleted survey response.
Two new reports have been added to the ‘Reports’ section of the Analytics console: ‘Service Cost’ and ‘Service Cost by Service’.
To give organizations better insight into requests that were responsible for breaching at least one affected SLA target, two new reports have been created.
The ‘Changes by Effort Indication’ reports have been revised to better compare actual with planned effort, including time spent on related requests and problems.
Organizations can now decide whether time entries registered in their account can be visible in a trusted account.
New reports and filters have been added to give organizations more insight into how time was spent, and what the related costs were.
As time records are important in tracking the total costs of a service, financial managers can now access the time entry data reports.
To give insight into how request registrations are distributed over time, two new reports have been created, one of which a heatmap.
Reports, including all selected filters and other presentation options, can now be directly added to existing or new dashboards.
As changes can consist of several tasks, two new reports have been created to show organizations the completion duration of individual tasks.
A new filter has been added to the SLA reports. It limits the data to the affected SLAs linked to requests from a specific source.
Service providers with multiple customers can now apply a filter on 'Requester organization’ for task views and reports.
To explain exactly how the actuals are calculated in SLA reports, an information icon has been added to these reports for each KPI.
A description is now available in Xurrent for every standard report to explain how the data points are calculated.
A new report has been added to the ‘Reports’ section of the Analytics console. The new report is called ‘SLA Availability’. It offers a graphical representation of target and actual availability over time. The data used to generate this report is the same as the data that can be found in the ‘SLA Reports‘ section […]
Shareable URLs now stop working when their creator's person record is disabled in Xurrent, or when this person no longer has a role.
The filter 'Serial number' has become available in the configuration item (CI) views and reports of the Xurrent service.
The link rate calculation for the report ‘Knowledge Article Link Rate’ has been adjusted to better align with the KCS methodology.
Two more reports to help organizations track the amount of time, and the number of times, work is performed for each service.
All graphs available in the 'KPIs' section are now available in the 'Reports' section so that they can be placed on dashboards.
To make it easy to define a future date range for a view or report, a whole set of 'Quick Ranges' has been added.
The filters 'User' and 'User organization' have become available for the configuration item (CI) views and reports.
Now people can place a report on a dashboard and quickly duplicate this report to prepare multiple variations of it.
The Add Reports button of a dashboard now becomes inactive when the maximum number of reports has been added to the dashboard.
Organizations that are using release records to group changes are now able to filter the views and reports for changes and tasks by release.
The date range limit for reports has been relaxed to 60 months, allowing organizations to run reports covering up to 5 year's worth of data.
A few more date range filters have become available to create more specific views and reports of several record types.
Now organizations can look up the number of affected SLAs in the report 'Percentage of SLA Resolution Targets Met and Violated by Service'.
A new filter has become available that makes it possible to filter the SLA reports in the 'Reports' section by a specific SLA.
Xurrent now also makes it easy to define 'Next Business Day' SLA targets, which are commonly offered by managed service providers (MSPs).
A decision by an account administrator is now required to switch on the option that allows people to submit requests for others in Xurrent Self Service.
A few reports have been renamed to make them easier to find when filtering the list of reports or when adding reports to a dashboard.
The filters that have been applied to a view can now be hidden to make more space available for the items that are listed in the view.
When a dashboard is opened in View mode, its filters are no longer visible. This minimizes the clutter and maximizes the space available for reports.
When selecting reports to apply to a dashboard, the appropriate report type icon is now presented for each report suggestion.
HR departments can make use of the request template functionality and dashboard capabilities to see how the Coronavirus is affecting their employees.
The filter 'Supplier' has been added for configuration item (CI) views and reports to help configuration managers maintain a clean CMDB.
Two new filters have become available for the change views in the Records console and for the change reports in the Analytics console.
The logic that Xurrent uses to look up the most appropriate service and customer organization for each time entry has improved.
The scope of filters for dashboards has been expanded to give support organizations the filter options they need when they are preparing their dashboards.
A set of time spent reports has become available that makes it easier to identify requests that specialists have spent a significant amount of time on.
A few more popular date ranges have become available as Quick Ranges to make it easier to apply these common ranges to a view or report.
The logic that dictates when a specialist should be prompted to apply the configuration item that caused an incident is now just a little more clever.
The option 'Service Navigator' is now also available in the Actions menu for people who are working the 'SLA Reports' section of Xurrent's Analytics console.
The actual availability calculation for the current month has been adjusted to reflect what the actual availability will be at the end of the month if no more outages occur.
It is now possible for organizations to see how many of their requests were submitted by a requester who used the Xurrent App.
A total of 6 new reports have been added for the support of the Project Management process.
Two more reports have been added to the 'Reports' section of the Analytics console for the change and project management processes.
The list of product reports has been optimized to make sure that they can also be used to obtain an overview of the disabled products.
All the time tracking reports in Xurrent now provide the ability to drill down into the time entries that are included in them.
To facilitate more precise resource planning, Xurrent now allows the planned duration and planned effort to be specified in hours and minutes.
It is now possible to define a custom date range filter for a view or report to look at data that is already several years old.
From now on, a request is also considered ‘picked up’ as soon as it has been assigned to a member of the service desk team.
It has become possible to add, adjust and remove the filters of shared dashboards, even when you do not have the access rights to place them in Edit mode.
Two sources have been renamed in the request reports that break down the number of requests by source.
A new column has been added to the list of reports. This column provides an indication of the chart type for each report.
The 'Satisfaction' and 'Account' filters have become available to make it possible to prepare more advanced request views and reports.
After having applied a filter to a report, it is now possible to edit this filter by adding more options to it, or removing previously selected options.
A new SLA report has been added for support organizations that want to set a target for each commonly submitted RFCs or RFI.
The report ‘Completed Changes by Completion Reason‘ has been added to the 'Reports' section of the Analytics console.
The 'Member' filter has become available for the request and task views in the Records console and for the request and task reports in the Analytics console.
The quick ranges that allow people to select a popular date range for a report have been improved to make them easier to understand.
Two advanced reports have been added to help support organizations track the satisfaction responses from their customers.
When you drill down from an SLA report into the requests, it is now easier to identify the requests that a provider was no longer expected to complete.
The filter option 'Source' has been added to the request reports.
The report ‘Open Requests by Business Unit’ has been added to the ‘Reports’ section of Xurrent’s Analytics console. This report is especially useful for large enterprises that are organized in divisions or business units, each with their own departments. For such enterprises, this report can provide a more meaningful overview than the ‘Open Requests by […]
Yet another report has been added to the ‘Reports’ section of the Analytics console. This new report is called ‘Completed Requests by Completion Reason’. It is a horizontal bar chart which, by default, shows the number of requests that were completed with a specific completion reason over the past 3 months. This report can provide […]


.webp)