.webp)
%20(1).webp)
Blog
Insights & updates from our experts
Resolve issues quickly with an AI-powered system that automates ticketing.

Resolve issues quickly with an AI-powered system that automates ticketing.

Resolve issues quickly with an AI-powered system that automates ticketing.

Resolve issues quickly with an AI-powered system that automates ticketing.
Resolve issues quickly with an AI-powered system that automates ticketing.

Resolve issues quickly with an AI-powered system that automates ticketing.

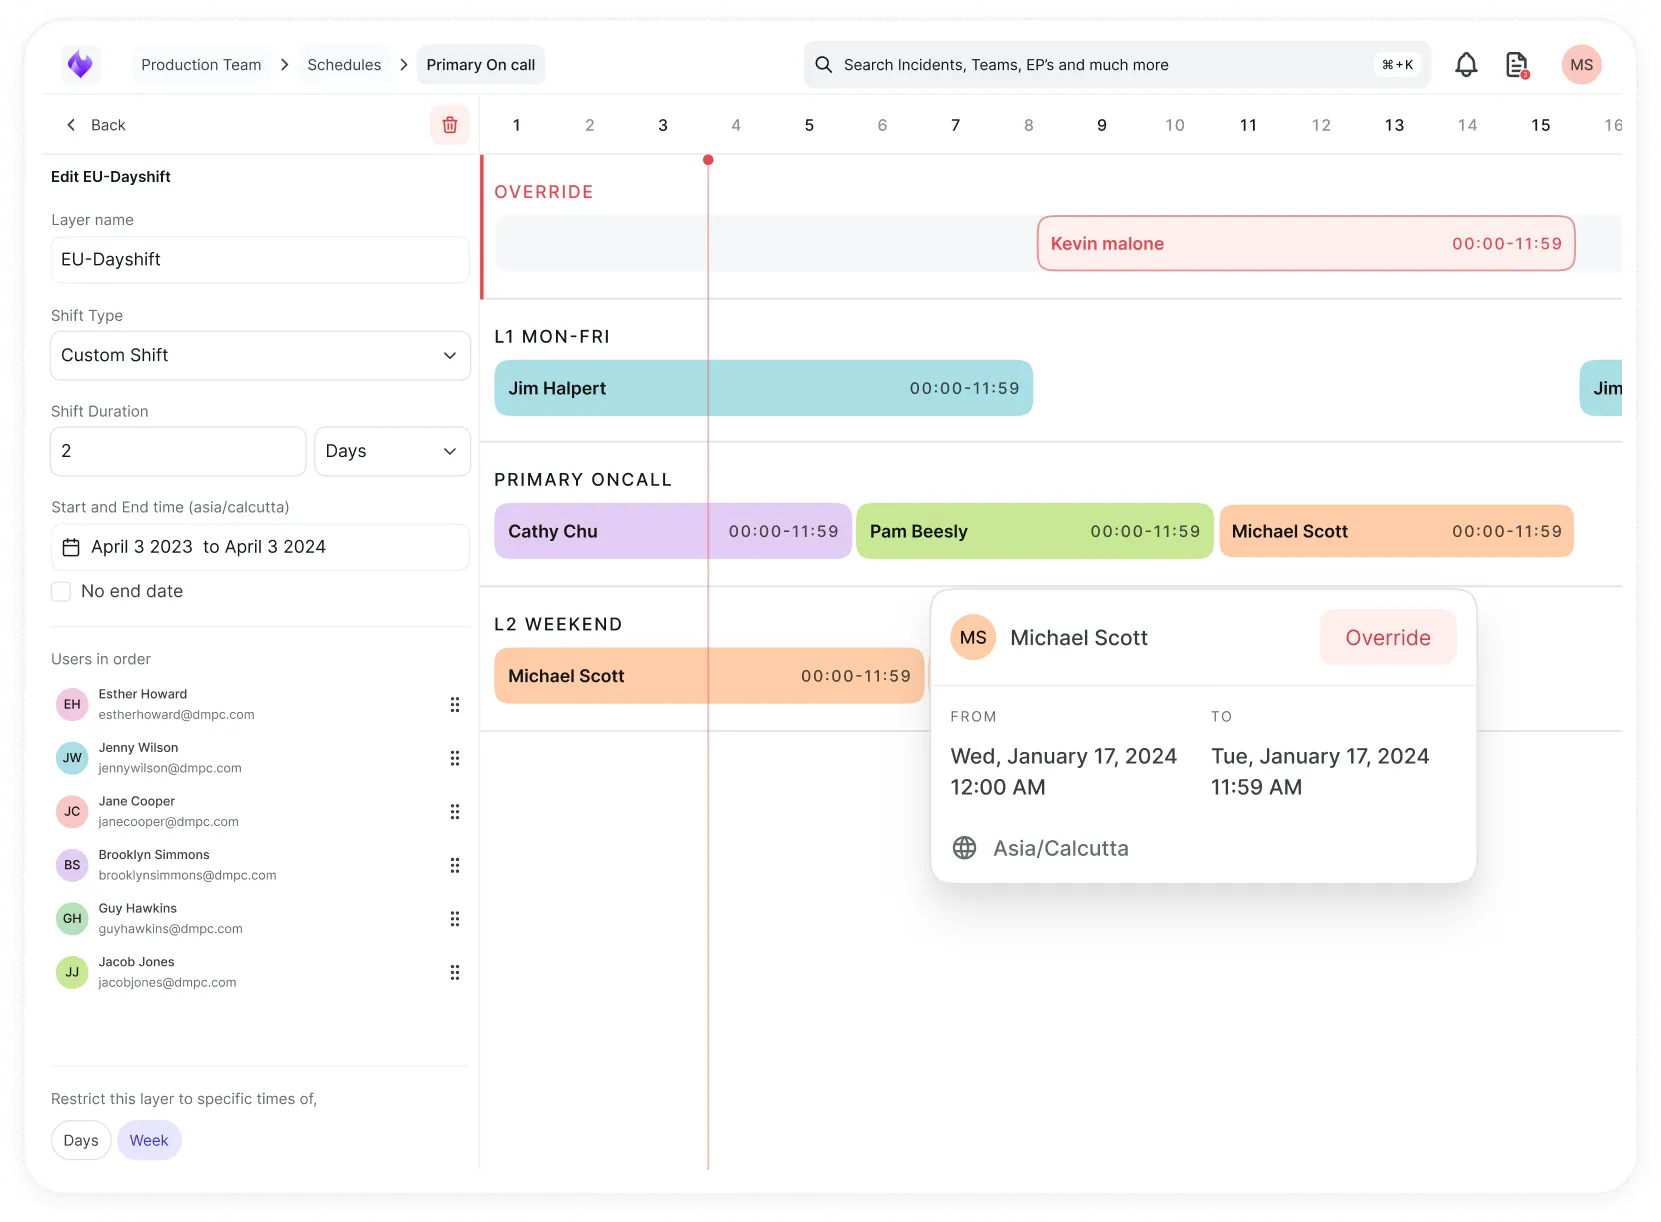
Simplify on-call scheduling, automate escalations, and reduce burnout.
Automate postmortems, AI summaries, and post-incident workflows
We're here to help

The integration with Atlassian Jira using the Xurrent Integration Service is

The integration with Atlassian Jira using the Xurrent Integration Service is

The integration with Atlassian Jira using the Xurrent Integration Service is

The integration with Atlassian Jira using the Xurrent Integration Service is

The integration with Atlassian Jira using the Xurrent Integration Service is

The integration with Atlassian Jira using the Xurrent Integration Service is

The integration with Atlassian Jira using the Xurrent Integration Service is

The integration with Atlassian Jira using the Xurrent Integration Service is
Resolve issues quickly with an AI-powered system that automates ticketing.
Resolve issues quickly with an AI-powered system that automates ticketing.
Simplify on-call scheduling, automate escalations, and reduce burnout.
Automate postmortems, AI summaries, and post-incident workflows
Resolve issues quickly with an AI-powered system that automates ticketing.
Resolve issues quickly with an AI-powered system that automates ticketing.
Resolve issues quickly with an AI-powered system that automates ticketing.
Resolve issues quickly with an AI-powered system that automates ticketing.

We are here to help 24/7

Connect with other Xurrent Users

Get insights and tips on how to get the most out of Xurrent

Apps, APIs, and updates

Xurrent service functionality
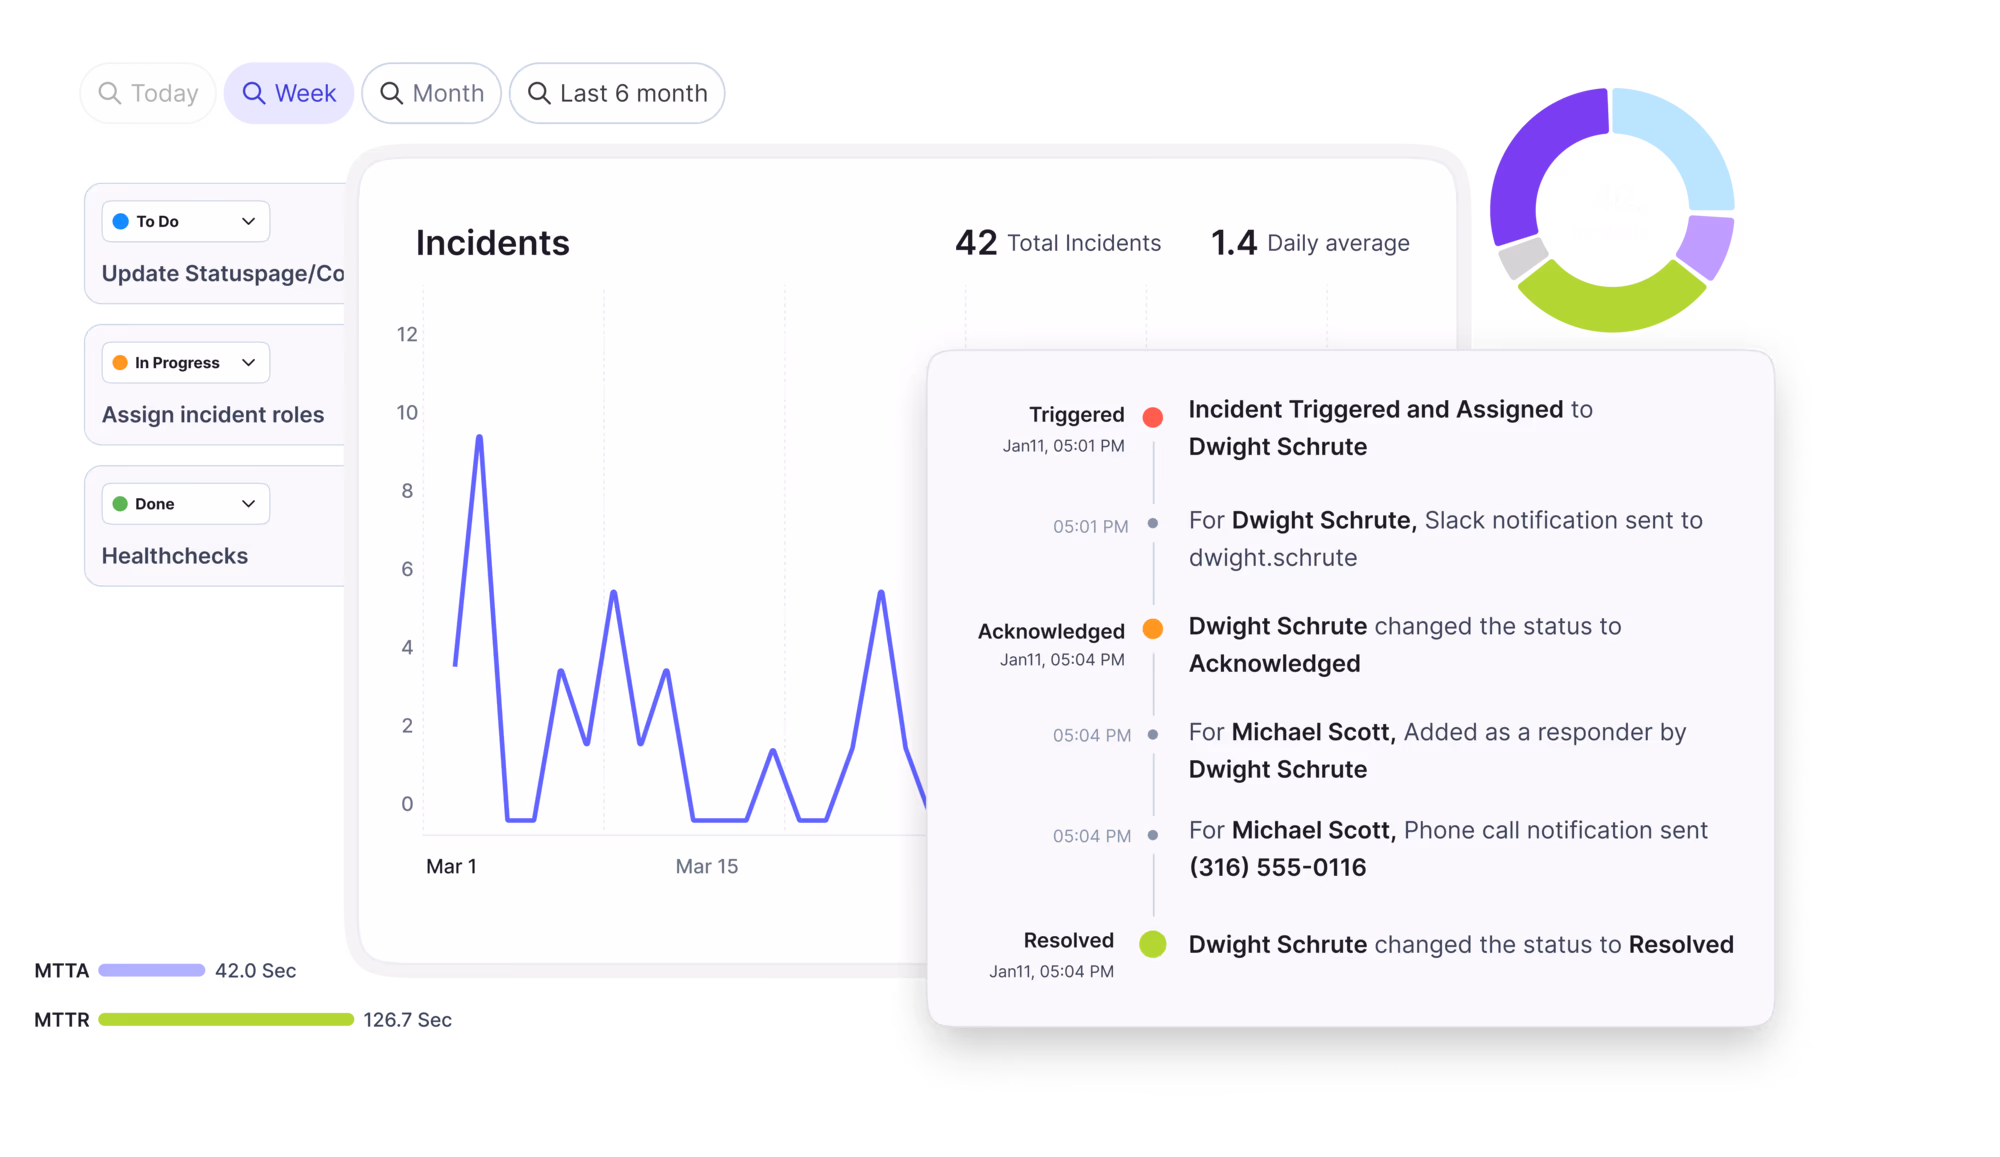
Eliminate manual tasks, optimize workflows, and deliver faster resolutions.
Learn how organizations have reduced downtime, improved 50% MTTA & MTTR, and cut costs with Xurrent IMR.
Discover Xurrent IMR's quick support, bidirectional integrations with Jira and Slack, and more cohesive incident response capabilities compared to Opsgenie.
Understand why users value Xurrent IMR for its intuitive interface, efficient incident alerting, customizable On-call schedules, and escalations.

Two new reports have been added to the ‘Reports’ section of the Analytics console: ‘Service Cost’, showing the total costs of all services within a selected date range, and ‘Service Cost by Service’, showing the total costs of all services within a selected date range, grouped by service. As they present financial data, these reports are only visible to people with the Financial Manager or Auditor role.
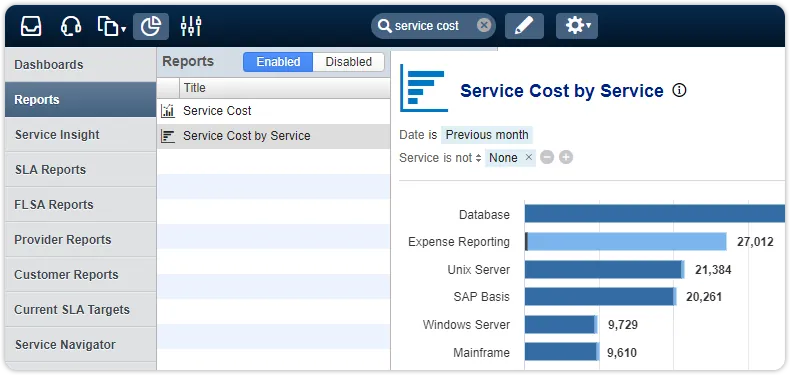
Both reports present the monthly costs related to services, consisting of expenses (dark blue, related to invoices) and spent time (light blue, related to time entries). Just as in the ‘Service Insight’ dashboard, clicking on the respective parts of the chart takes the user to the ‘Expenses’ view or the ‘Time entries’ view. An example of the ‘Expenses’ view for the Warehouse Management service is shown in the screenshot below.

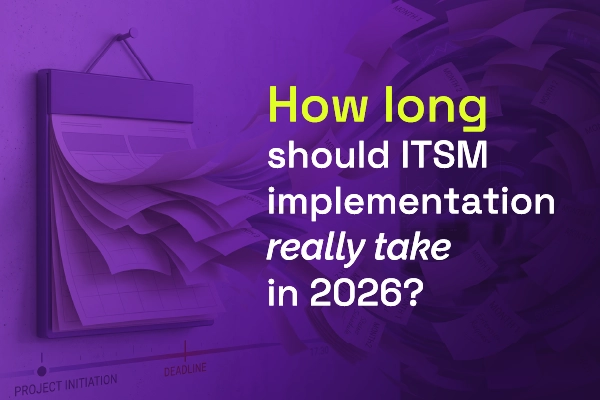
Most vendors will tell you ITSM implementation takes six months to a year — but modern, configuration-first platforms have rewritten the math entirely. See what real implementations look like in 2026, and why a long rollout is now a choice, not a given.


.webp)