.webp)

Blog
Insights & updates from our experts
Resolve plant floor and IT issues before they disrupt production.

Stay audit-ready while resolving issues and reducing operational risk.
Resolve issues quickly with an AI-powered system that automates ticketing.

Resolve issues quickly with an AI-powered system that automates ticketing.

Simplify on-call scheduling, automate escalations, and reduce burnout.
Automate postmortems, AI summaries, and post-incident workflows
We're here to help

The integration with Atlassian Jira using the Xurrent Integration Service is

The integration with Atlassian Jira using the Xurrent Integration Service is

The integration with Atlassian Jira using the Xurrent Integration Service is

The integration with Atlassian Jira using the Xurrent Integration Service is

The integration with Atlassian Jira using the Xurrent Integration Service is

The integration with Atlassian Jira using the Xurrent Integration Service is

The integration with Atlassian Jira using the Xurrent Integration Service is

The integration with Atlassian Jira using the Xurrent Integration Service is
Resolve issues quickly with an AI-powered system that automates ticketing.
Resolve issues quickly with an AI-powered system that automates ticketing.
Simplify on-call scheduling, automate escalations, and reduce burnout.
Automate postmortems, AI summaries, and post-incident workflows
Resolve plant floor and IT issues before they disrupt production.
Stay audit-ready while resolving issues and reducing operational risk.

Detect, respond, and resolve incidents fast to cut downtime and MTTR.

Keep your store online, even during your biggest sales moments.
Protect patient data and resolve issues fast, so care teams stay focused on care.
Standardize service delivery across every store and channel.

We are here to help 24/7

Connect with other Xurrent Users

Get insights and tips on how to get the most out of Xurrent

Apps, APIs, and updates

Xurrent service functionality
Eliminate manual tasks, optimize workflows, and deliver faster resolutions.
Learn how organizations have reduced downtime, improved 50% MTTA & MTTR, and cut costs with Xurrent IMR.
Discover Xurrent IMR's quick support, bidirectional integrations with Jira and Slack, and more cohesive incident response capabilities compared to Opsgenie.
Understand why users value Xurrent IMR for its intuitive interface, efficient incident alerting, customizable On-call schedules, and escalations.
In most organizations, incident management operates in silos.
IT handles infrastructure alerts.
The service desk manages user issues.
Operations teams track their own metrics.
Houston, we have a problem.
Silos. Tracking own metrics. Low visibility. All make organizations vulnerable to prolonged disruptions, increased financial and reputational losses, regulatory penalties, and missed threats.
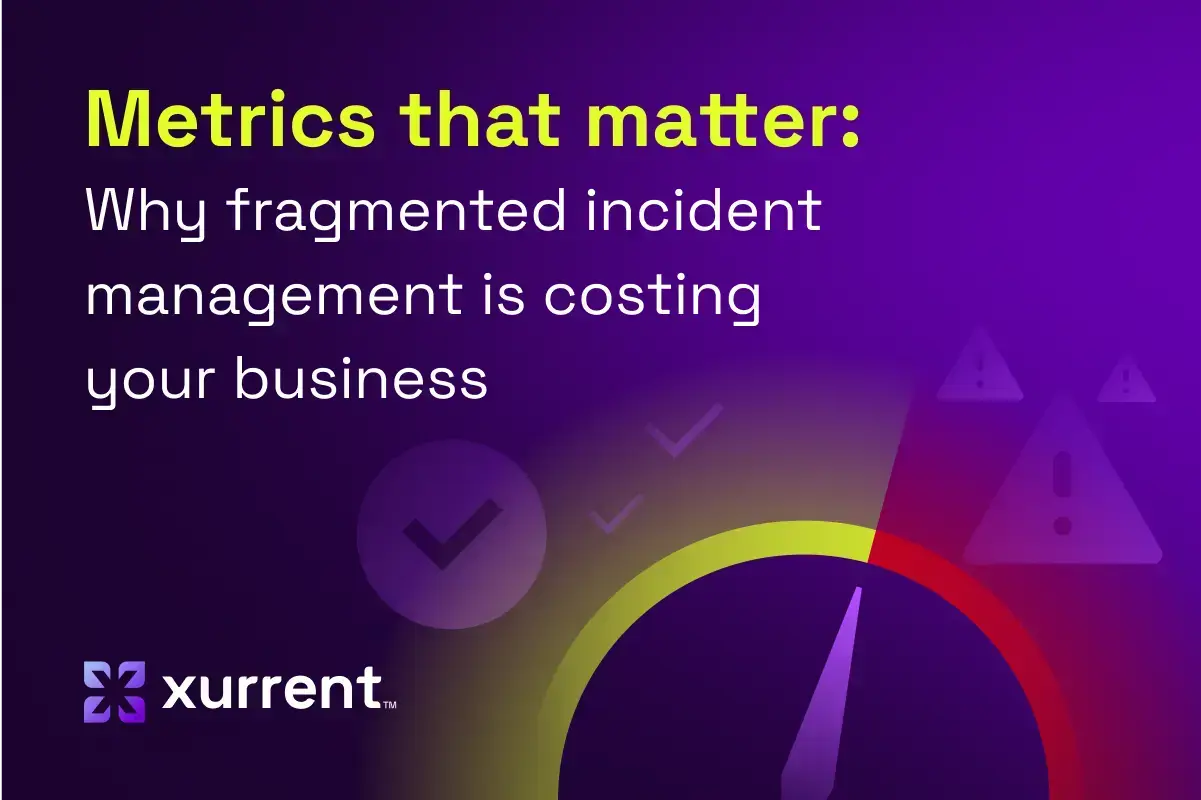
Metrics matter.
As Austrian-American consultant and educator, Peter Drucker, famously said, "If you can't measure it, you can't improve it."
Said another way, organizations can't optimize what they can't properly measure.
Fragmented incident management metrics are costing companies big time.
Multiple dashboards, conflicting data sources, and incomplete visibility all contribute to this "hidden cost."
Picture this: It's 2:30 PM on a Tuesday when the marketing team's CRM system suddenly stops responding.
Another successful day for the IT team.
Not so fast.
The marketing team spent another hour and a half waiting for their CRM application to fully sync and become usable again. During this time, they were unable to access customer data for three sales calls, missed following up on two hot leads, and had to manually track prospect information in spreadsheets.
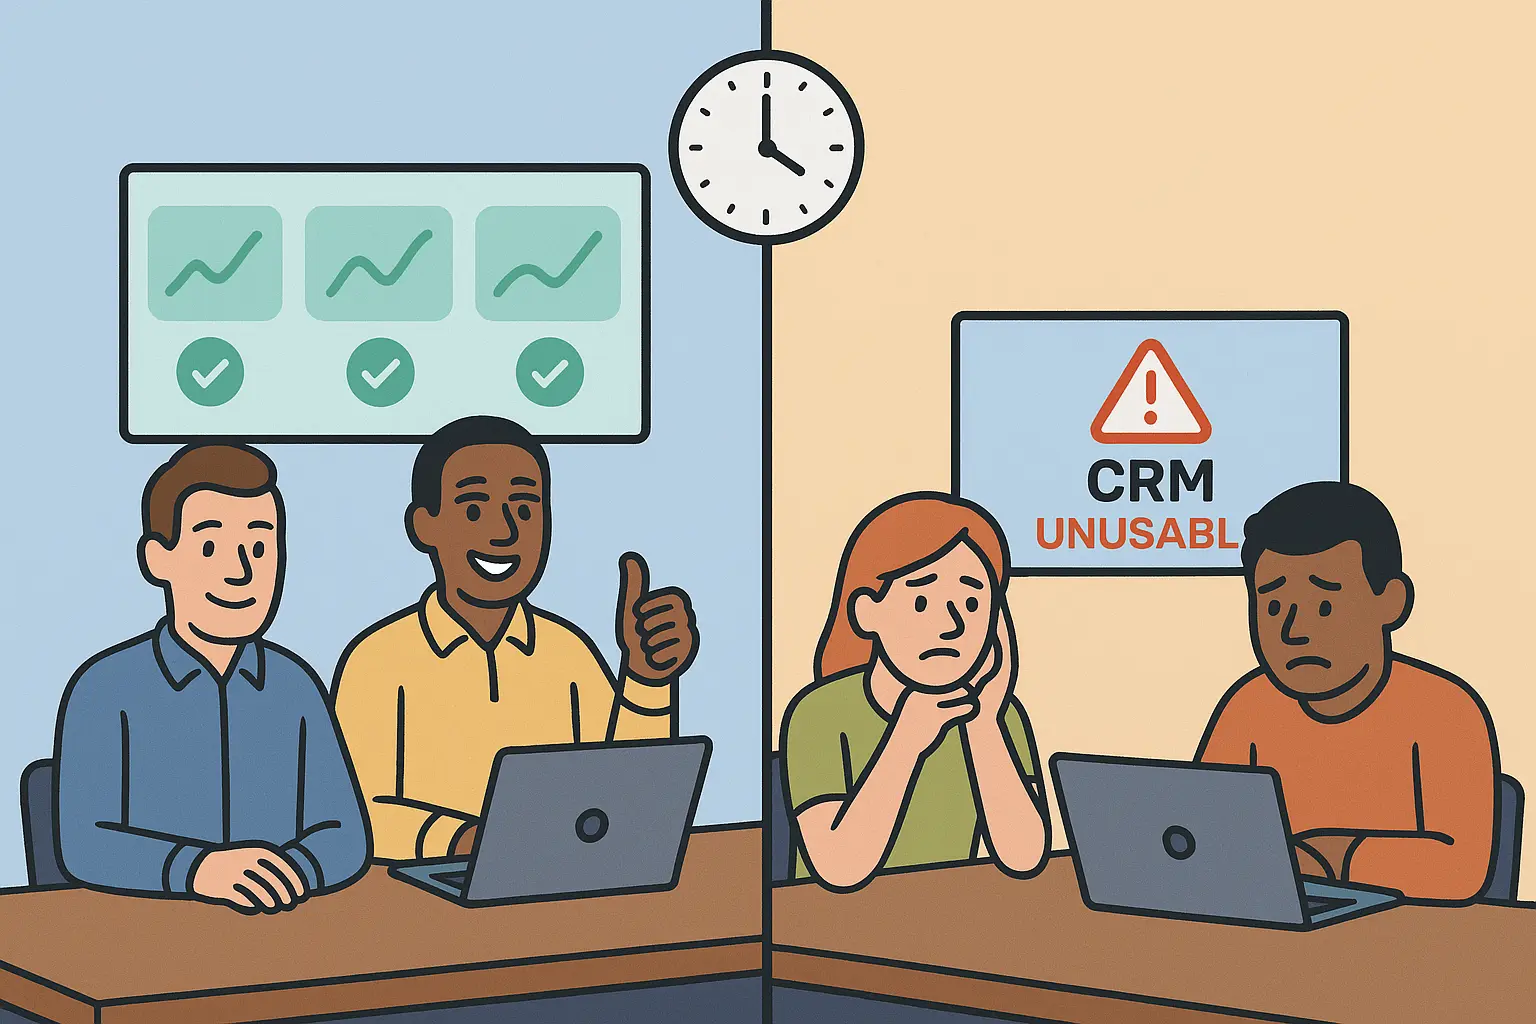
The real business impact didn't end until 4:45 PM ... a full 2 hours and 15 minutes after the initial outage.
This "measurement gap" scenario plays out daily across organizations worldwide.
IT's monitoring tools measured infrastructure availability, while users experienced application functionality and business process recovery.
Without unified incident management, these two realities operate in parallel universes — each telling a different story about the same event.
The measurement gap creates a domino effect of false confidence, misallocated resources, reactive management, and eroded trust.
False confidence: IT reports improving MTTR trends while user satisfaction scores decline.
Misallocated resources: Teams optimize for technical metrics that don't reflect actual business impact.
Reactive management: Leadership makes decisions based on incomplete data, always one step behind real problems.
Eroded trust: Business stakeholders lose confidence in IT's ability to understand their needs.
Here's the good news: there's a way to break this destructive cycle.
Every modern enterprise needs a modern service desk solution that provides unified visibility across all incident touchpoints.
But what does "unified" actually mean in practice? And more importantly, what metrics should you be tracking to prove its value?

Instead of measuring technical restoration in isolation (see "Another successful day for the technical team" above), unified incident management must track "business-aligned metrics."
Specifically, these 4:
1. End-to-end resolution time: From initial business impact to complete operational restoration — not just infrastructure recovery.
In our CRM example ... this metric would have captured the full 2 hours and 15 minutes of business disruption, not just the 45-minute database fix, providing leadership with accurate data for resource allocation and SLA management.
2. First contact resolution rate: Percentage of incidents entirely resolved on first interaction, eliminating the handoff delays that create measurement gaps.
In our CRM example ... if the infrastructure team had understood that database restoration required CRM synchronization time, they could have proactively communicated realistic timelines to the marketing team instead of prematurely declaring victory.
3. Business process recovery time: How quickly affected workflows return to regular operation, including data synchronization and user access.
In our CRM example ... this would have measured when the marketing team could actually access customer data and resume sales calls, i.e., the true moment of service restoration, rather than when technical monitoring showed green lights.
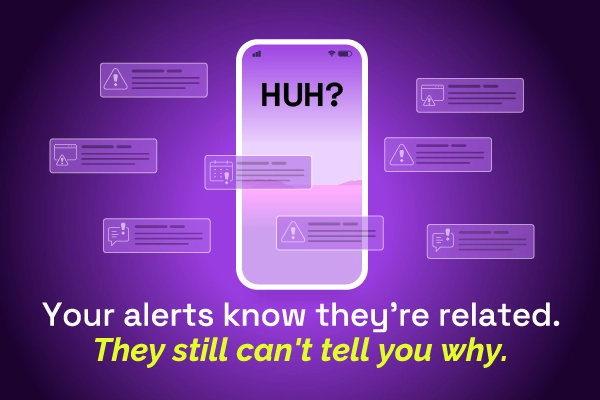
4. Cross-channel incident correlation: Connecting infrastructure alerts with user-reported issues to see the complete picture from the start.
In our CRM example ... instead of IT celebrating a quick database fix while marketing struggled with an unusable CRM, unified correlation would have revealed the full scope of impact immediately, enabling proper communication and expectation management across teams.
But knowing what to measure is only half the battle. Here's how to actually implement these business-aligned metrics.
Start with business impact metrics first, then layer in technical indicators. Here's the 4-step framework:
These four steps eliminate the measurement gaps that leave organizations flying blind during critical incidents.

Oh, and you'll never again have IT reporting 45-minute resolutions while users experience 2+ hour disruptions.
The question isn't whether you can afford to implement unified measurement — it's whether you can afford to keep operating with blind spots that cost time, money, and credibility.
Ready to gain complete visibility into your incident management performance?
Get started with Xurrent today and discover what unified metrics can reveal about your operations.
The hidden cost arises from multiple dashboards, conflicting data sources, and incomplete visibility, which create a "measurement gap." This occurs when IT measures technical restoration (such as database connectivity being restored in 45 minutes), while users experience a much longer business impact (like CRM being unusable for over 2 hours). This gap leads to false confidence, misallocated resources, reactive management, and eroded trust between IT and business stakeholders.
Unified incident management is a modern service desk solution that provides unified visibility across all incident touchpoints. Instead of measuring technical restoration in isolation, it tracks "business-aligned metrics" that capture the complete picture from initial business impact to full operational restoration. This approach eliminates the measurement gaps that leave organizations vulnerable to prolonged disruptions and increased financial losses.
The four essential metrics are: (1) End-to-end resolution time - from initial business impact to complete operational restoration, (2) First contact resolution rate - percentage of incidents resolved on first interaction, (3) Business process recovery time - how quickly affected workflows return to regular operation, including data synchronization and user access, and (4) Cross-channel incident correlation - connecting infrastructure alerts with user-reported issues to see the complete picture.
The measurement gap creates a domino effect, where IT reports improvements in technical metrics while user satisfaction declines. For example, IT might celebrate a 45-minute database fix while the marketing team experiences a 2+ hour CRM outage. This leads to false confidence in IT performance, misallocation of resources toward technical metrics that don't reflect business impact, and reactive management based on incomplete data.
Fragmented incident management creates four main consequences: false confidence (IT reports improving MTTR trends while user satisfaction scores decline), misallocated resources (teams optimize for technical metrics that don't reflect actual business impact), reactive management (leadership makes decisions based on incomplete data), and eroded trust (business stakeholders lose confidence in IT's ability to understand their needs).
Organizations can implement a 4-step framework: (1) Map business processes to technical systems to understand true dependencies, (2) Establish unified dashboards to create a single source of truth for all stakeholders, (3) Implement cross-functional alerting to ensure business teams know about technical issues before users call, and (4) Track correlation metrics to measure how well technical restoration translates to business recovery.
Most organizations operate with IT handling infrastructure alerts, service desks managing user issues, and operations teams tracking their own metrics in isolation. This siloed approach creates low visibility and makes organizations vulnerable to prolonged disruptions, increased financial and reputational losses, regulatory penalties, and missed threats because each team measures different aspects of the same incidents.
End-to-end resolution time measures the complete duration from initial business impact to full operational restoration, not just infrastructure recovery. This metric captures the actual business disruption time, rather than just the technical fix time. For example, instead of measuring only a 45-minute database fix, it would capture the full 2 hours and 15 minutes until users could actually access and use their CRM system again.
Cross-channel incident correlation connects infrastructure alerts with user-reported issues to provide the complete picture from the start. Instead of IT celebrating a quick technical fix while business users struggle with ongoing issues, unified correlation reveals the full scope of impact immediately, enabling proper communication and expectation management across all affected teams.
Business process recovery time measures how quickly affected workflows return to regular operation, including data synchronization and user access. This metric focuses on when users can actually perform their work again, rather than when technical monitoring shows green lights. It captures the true moment of service restoration from the business perspective, ensuring that incident resolution aligns with actual operational needs.
Everyone knows the boy who cried wolf. He sounded the alarm for fun, the village came running, and after a few false alarms they stopped coming. Then the wolf showed up for real, and the story ends the way you remember.Every on-call engineer is living the grown-up version. The alerts cry wolf all day, so you learn to tune them out. Then one night a page you'd have ignored is the outage, and by the time you look, it's already bad.

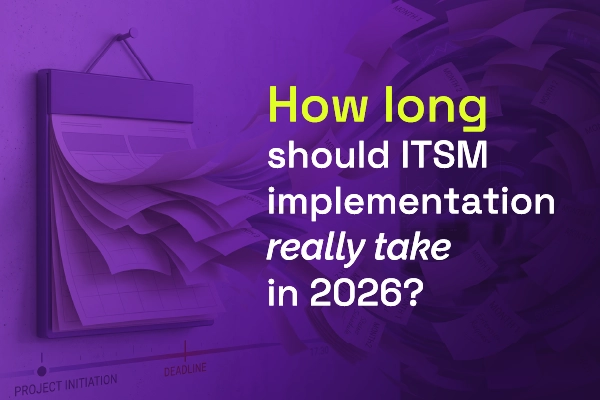
Most vendors will tell you ITSM implementation takes six months to a year — but modern, configuration-first platforms have rewritten the math entirely. See what real implementations look like in 2026, and why a long rollout is now a choice, not a given.

.webp)

.webp)
.webp)