.webp)

Blog
Insights & updates from our experts
Resolve plant floor and IT issues before they disrupt production.

Stay audit-ready while resolving issues and reducing operational risk.
Resolve issues quickly with an AI-powered system that automates ticketing.

Resolve issues quickly with an AI-powered system that automates ticketing.

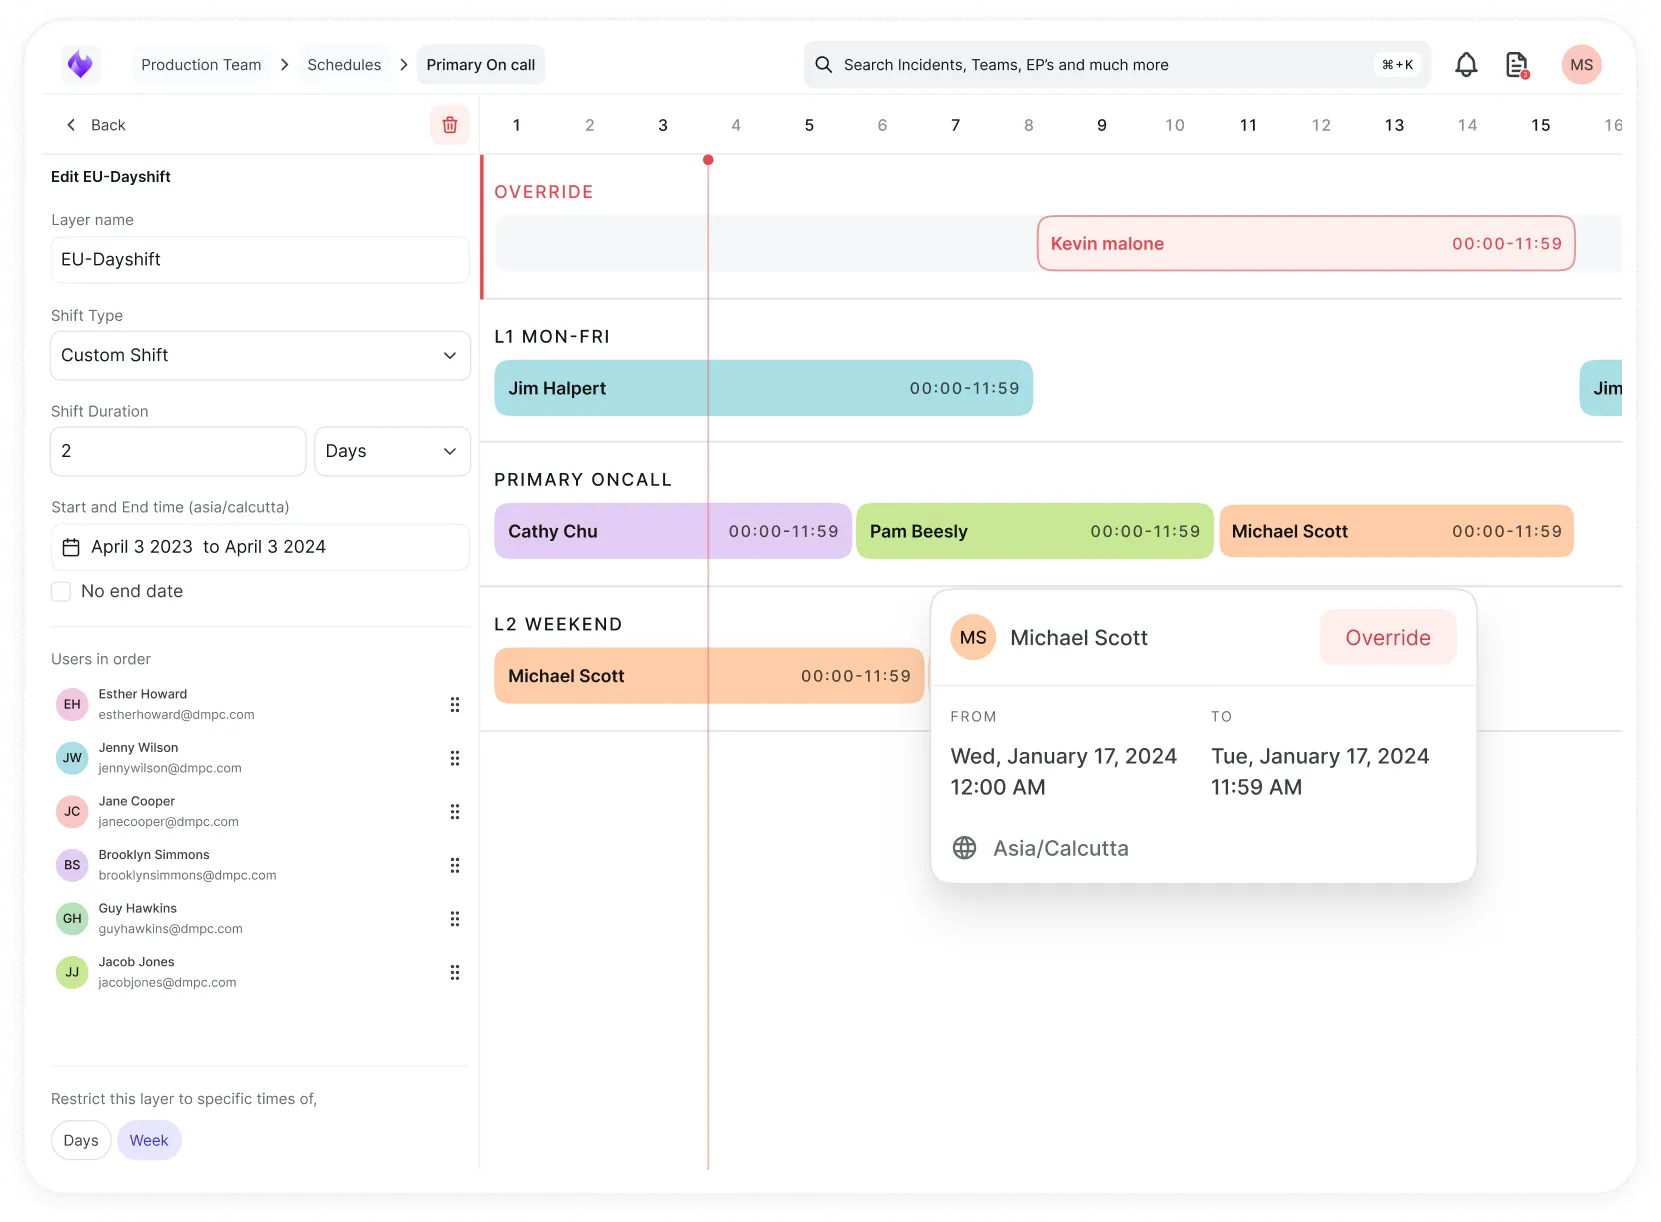
Simplify on-call scheduling, automate escalations, and reduce burnout.
Automate postmortems, AI summaries, and post-incident workflows
We're here to help

The integration with Atlassian Jira using the Xurrent Integration Service is

The integration with Atlassian Jira using the Xurrent Integration Service is

The integration with Atlassian Jira using the Xurrent Integration Service is

The integration with Atlassian Jira using the Xurrent Integration Service is

The integration with Atlassian Jira using the Xurrent Integration Service is

The integration with Atlassian Jira using the Xurrent Integration Service is

The integration with Atlassian Jira using the Xurrent Integration Service is

The integration with Atlassian Jira using the Xurrent Integration Service is
Resolve issues quickly with an AI-powered system that automates ticketing.
Resolve issues quickly with an AI-powered system that automates ticketing.
Simplify on-call scheduling, automate escalations, and reduce burnout.
Automate postmortems, AI summaries, and post-incident workflows
Resolve plant floor and IT issues before they disrupt production.
Stay audit-ready while resolving issues and reducing operational risk.

Detect, respond, and resolve incidents fast to cut downtime and MTTR.

Keep your store online, even during your biggest sales moments.

Protect patient data and resolve issues fast, so care teams stay focused on care.

Standardize service delivery across every store and channel.

We are here to help 24/7

Connect with other Xurrent Users

Get insights and tips on how to get the most out of Xurrent

Apps, APIs, and updates

Xurrent service functionality
Eliminate manual tasks, optimize workflows, and deliver faster resolutions.
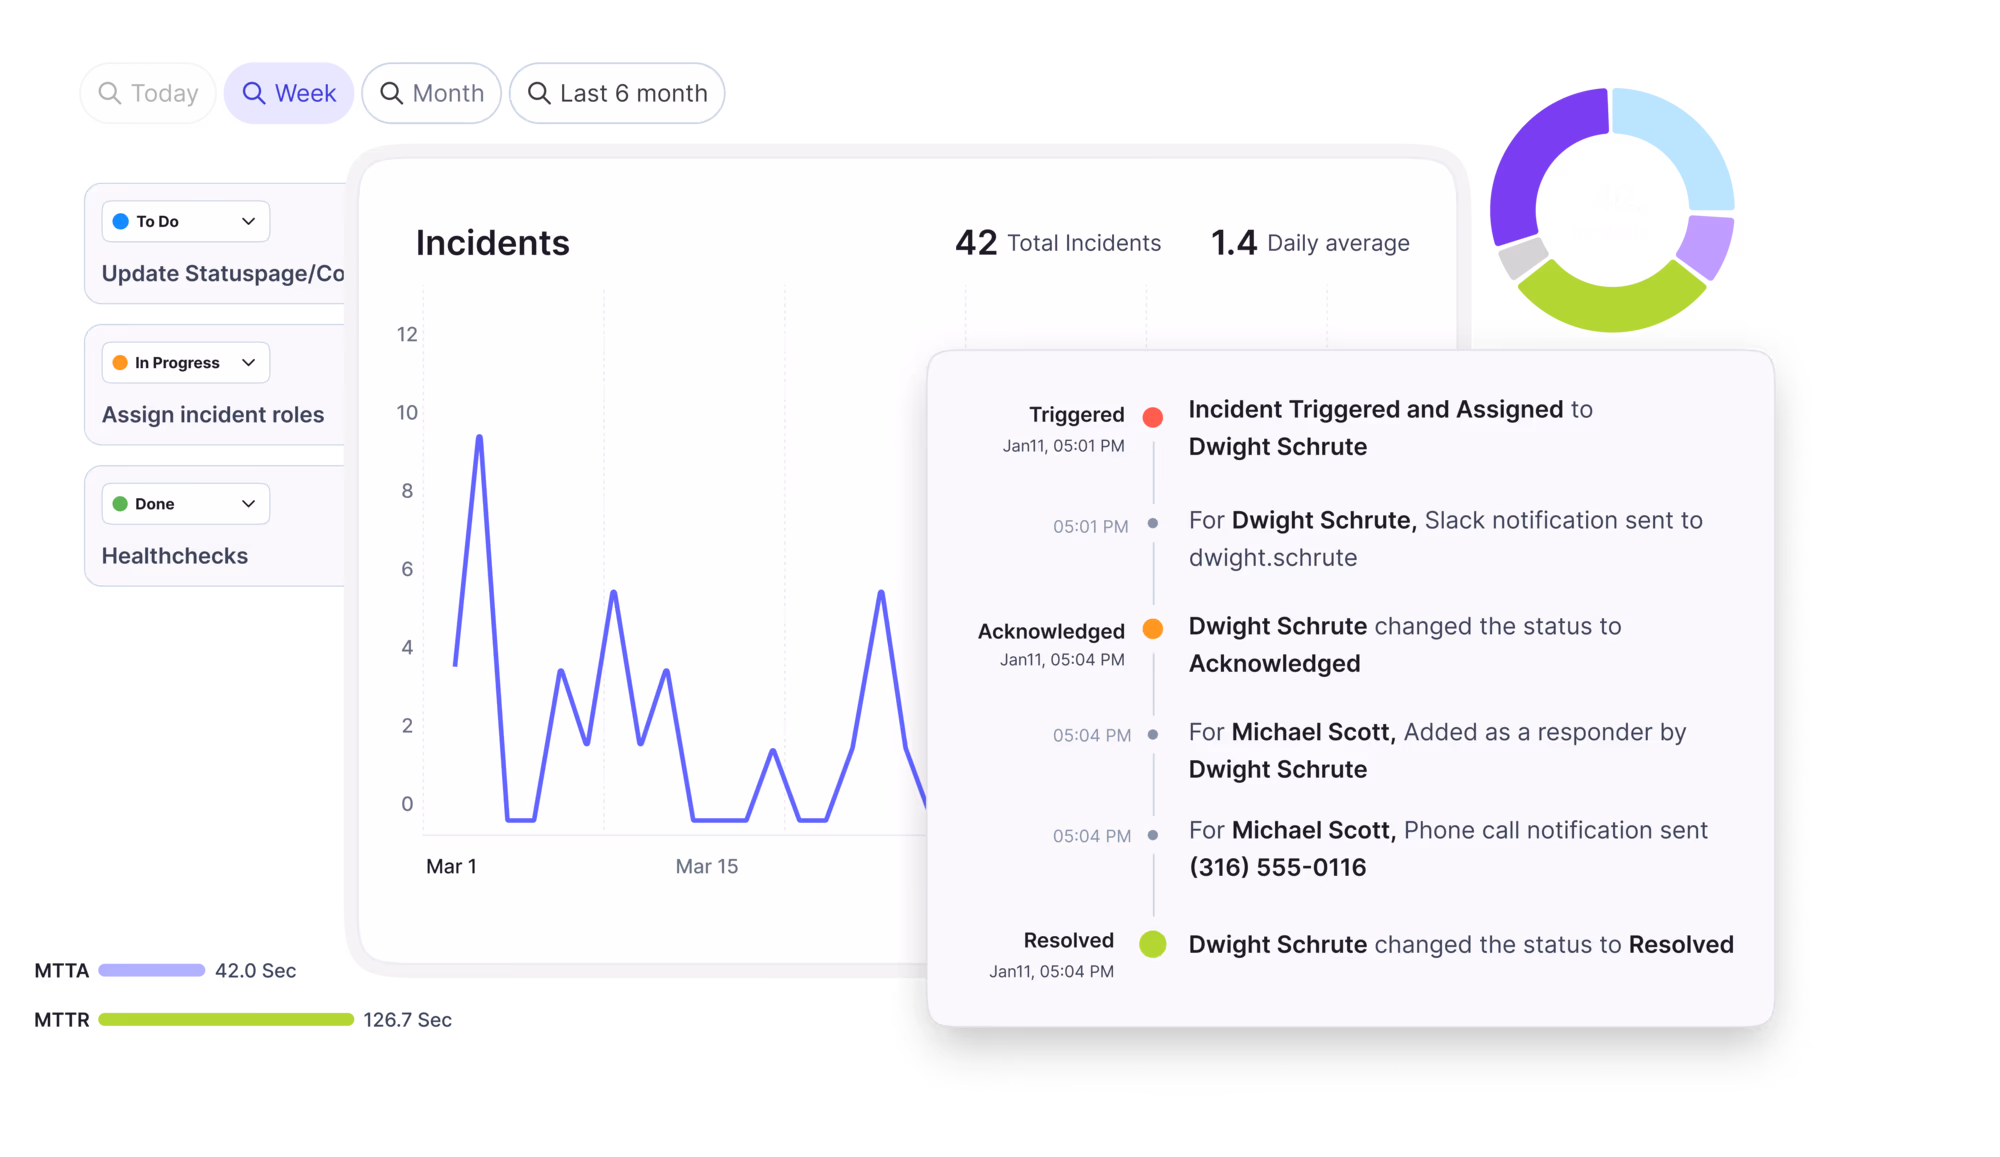
Learn how organizations have reduced downtime, improved 50% MTTA & MTTR, and cut costs with Xurrent IMR.
Discover Xurrent IMR's quick support, bidirectional integrations with Jira and Slack, and more cohesive incident response capabilities compared to Opsgenie.
Understand why users value Xurrent IMR for its intuitive interface, efficient incident alerting, customizable On-call schedules, and escalations.

All graphs that were available in the ‘KPIs’ section of the Analytics console are now available in the ‘Reports’ section. The advantages of having standard reports available for the KPIs are:
The standard reports people asked for most are the backlog reports, such as the ‘Project Backlog’ report and the ‘Project Backlog Growth’ report.
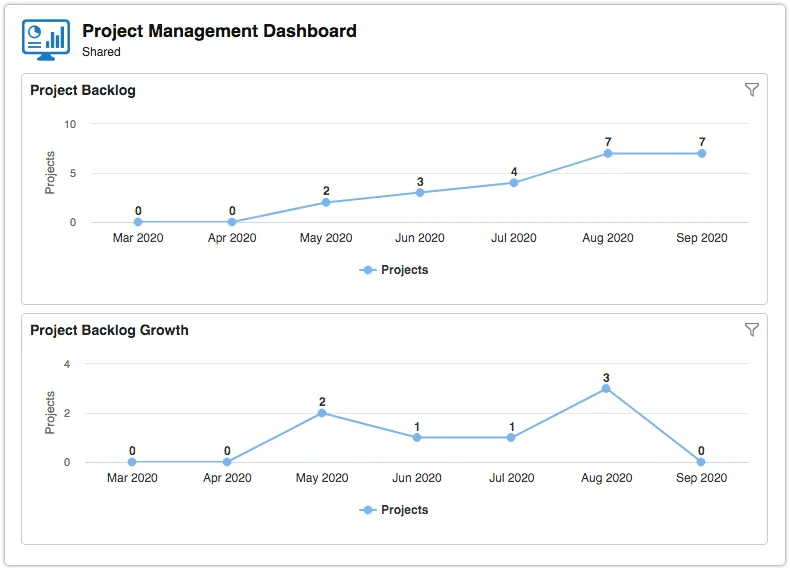
A total of 16 KPI reports have been added, including reports like:
Together this set of 16 new reports ensures that the ‘KPIs’ section of the Analytics console can be retired without any loss of functionality. That is why the ‘KPIs’ section is no longer visible when users go to the Analytics console.

Most vendors will tell you ITSM implementation takes six months to a year — but modern, configuration-first platforms have rewritten the math entirely. See what real implementations look like in 2026, and why a long rollout is now a choice, not a given.


.webp)

.webp)
.webp)