
.webp)
Blog
Insights & updates from our experts
Resolve issues quickly with an AI-powered system that automates ticketing.

Resolve issues quickly with an AI-powered system that automates ticketing.

Resolve issues quickly with an AI-powered system that automates ticketing.

Resolve issues quickly with an AI-powered system that automates ticketing.
Resolve issues quickly with an AI-powered system that automates ticketing.

Resolve issues quickly with an AI-powered system that automates ticketing.

Simplify on-call scheduling, automate escalations, and reduce burnout.
Automate postmortems, AI summaries, and post-incident workflows
We're here to help

The integration with Atlassian Jira using the Xurrent Integration Service is

The integration with Atlassian Jira using the Xurrent Integration Service is

The integration with Atlassian Jira using the Xurrent Integration Service is

The integration with Atlassian Jira using the Xurrent Integration Service is

The integration with Atlassian Jira using the Xurrent Integration Service is

The integration with Atlassian Jira using the Xurrent Integration Service is

The integration with Atlassian Jira using the Xurrent Integration Service is

The integration with Atlassian Jira using the Xurrent Integration Service is
Resolve issues quickly with an AI-powered system that automates ticketing.
Resolve issues quickly with an AI-powered system that automates ticketing.
Simplify on-call scheduling, automate escalations, and reduce burnout.
Automate postmortems, AI summaries, and post-incident workflows
Resolve issues quickly with an AI-powered system that automates ticketing.
Resolve issues quickly with an AI-powered system that automates ticketing.
Resolve issues quickly with an AI-powered system that automates ticketing.
Resolve issues quickly with an AI-powered system that automates ticketing.

We are here to help 24/7

Connect with other Xurrent Users

Get insights and tips on how to get the most out of Xurrent

Apps, APIs, and updates

Xurrent service functionality
Eliminate manual tasks, optimize workflows, and deliver faster resolutions.
Learn how organizations have reduced downtime, improved 50% MTTA & MTTR, and cut costs with Xurrent IMR.
Discover Xurrent IMR's quick support, bidirectional integrations with Jira and Slack, and more cohesive incident response capabilities compared to Opsgenie.
Understand why users value Xurrent IMR for its intuitive interface, efficient incident alerting, customizable On-call schedules, and escalations.
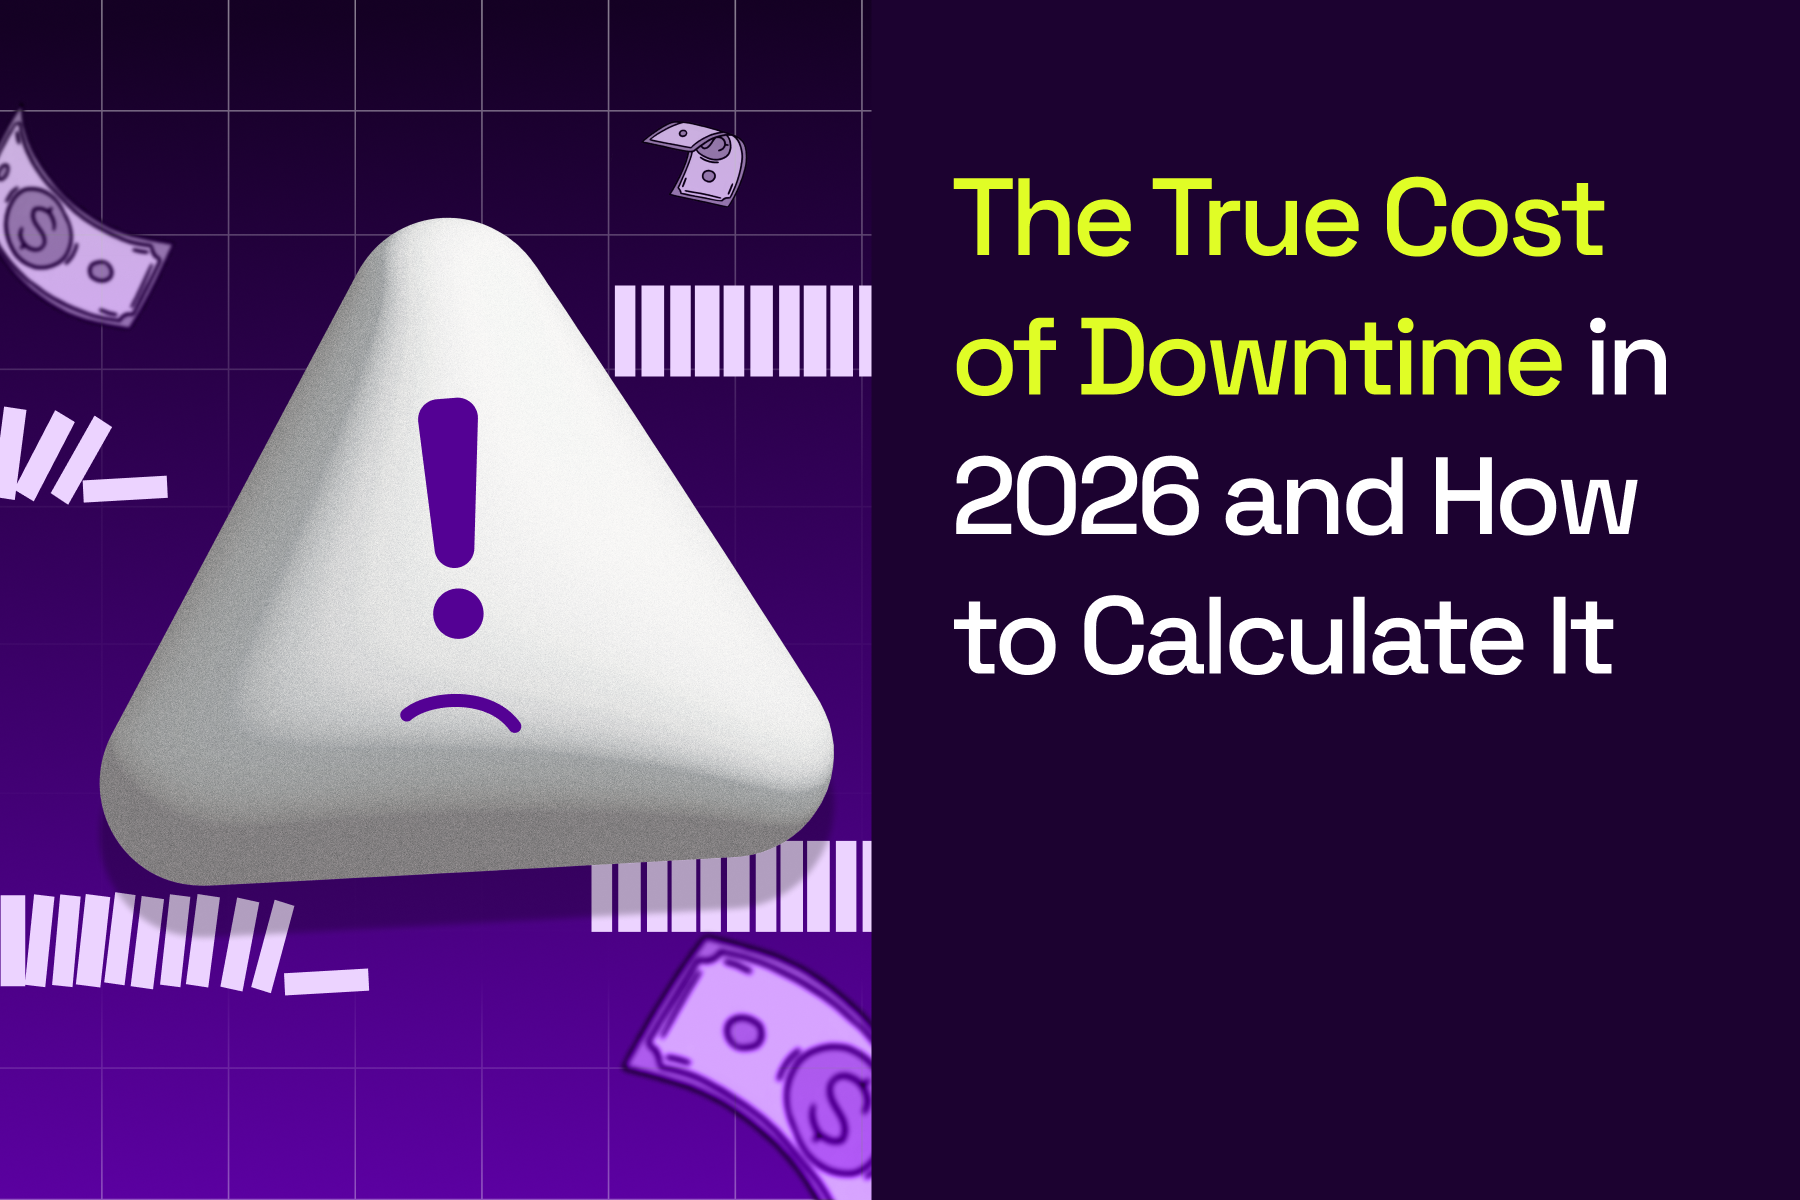
Every minute your systems are down, money walks out the door—and the meter runs faster than most teams realize. Industry research puts the average cost of downtime anywhere from $5,600 to over $15,000 per minute, depending on organization size and how dependent your operations are on digital systems.
The obvious losses—missed transactions, idle employees—are just the starting point. The full picture includes recovery labor, SLA penalties, customer churn, and reputational damage that compounds long after systems come back online. This guide breaks down how to calculate your actual downtime cost, what factors drive it, and the operational changes that reduce it.
Downtime cost is the total financial loss incurred when a business's operations or IT systems are interrupted. The impact varies widely by company size and industry, with small businesses typically losing $137 to $427 per minute while large enterprises can exceed $9,000 per minute.
When your systems go dark, the meter starts running immediately. Every minute without access to critical applications, customer-facing services, or internal tools translates into lost revenue, idle employees, and mounting recovery expenses.
The tricky part? Most teams only count the obvious losses. The full picture includes productivity hits, recovery labor, and long-term damage that doesn't show up on any invoice.
The numbers vary dramatically depending on what you're measuring and who's doing the measuring. Industry research puts the average cost anywhere from $5,600 per minute to over $15,000 per minute for organizations with significant digital operations.
Here's how costs typically break down by organization size:
Your actual cost depends on factors like revenue concentration, workforce size, and how dependent your operations are on digital systems. A company that processes transactions 24/7 faces a very different exposure than one that operates during business hours only.
Not all downtime hits equally. Industries with real-time transaction dependencies and regulatory exposure face the steepest penalties.
A retail site going down during Black Friday faces a fundamentally different cost profile than a B2B software company experiencing weekend maintenance issues.
Larger organizations have more revenue at stake during any given hour, but they also tend to have more redundancy, dedicated incident response teams, and recovery resources. Smaller businesses may face existential risk from prolonged outages.
The tradeoff isn't straightforward. A Fortune 500 company might lose $500,000 in an hour but recover quickly. A 50-person startup might lose $5,000 but struggle to survive the reputational damage.
How you make money shapes how downtime hurts you. B2B companies often face contractual SLA penalties when uptime guarantees are breached, while B2C companies experience immediate customer churn. Subscription models risk long-term retention when reliability erodes trust, whereas transactional models lose immediate sales but may recover faster.
Most teams calculate downtime cost by looking at lost revenue alone. That's a mistake. The full picture includes productivity losses, recovery expenses, and intangible costs that compound over time.
A more accurate formula looks like this:
Downtime Cost = (Lost Revenue + Lost Productivity + Recovery Costs + Intangible Costs) × Outage Duration
Direct costs are the obvious losses—the ones that show up immediately on the balance sheet.
If a network outage drops staff efficiency by 50%, that lost time adds up fast. And when you're paying IT staff overtime at 2 AM to restore systems, those costs compound quickly.
Indirect costs don't appear on an invoice, but they often exceed direct costs over time. Brand damage accumulates with each visible outage, especially when communication is poor. Customers switch to competitors after repeated reliability failures—and they rarely announce their departure. Meanwhile, deals get lost, product launches get delayed, and partnerships stall while teams scramble to recover.
For organizations in governed industries, downtime triggers additional financial exposure. SLA penalties are contractual fines activated when uptime guarantees are breached. Compliance violations can result in regulatory fines in healthcare, finance, and other industries with strict availability requirements. And downtime patterns that trigger deeper scrutiny often lead to expensive remediation requirements.
Calculating your actual downtime cost requires working through several components. The more precise your inputs, the more useful your output becomes for justifying reliability investments.
Start with your annual revenue and divide by the number of operating hours. A company generating $50 million annually that operates 24/7 earns roughly $5,700 per hour. A business-hours-only operation would divide by fewer hours, resulting in a higher hourly rate.
Estimate employee idle time using this approach: hourly wages × affected headcount × efficiency loss percentage. Then add anticipated recovery labor—overtime for IT staff, contractor fees, and any hardware replacement costs.
If you've committed to 99.9% uptime (often called "three nines"), you're allowed roughly 8.7 hours of downtime per year. Breaching that threshold triggers penalty costs that vary by contract but can reach significant percentages of annual contract value.
MTTR—Mean Time to Recovery—measures the average duration from incident detection to resolution. Reducing MTTR from 60 minutes to 30 minutes cuts your downtime cost in half, regardless of what that cost per minute happens to be. MTTR is the lever teams can actually control.
Tip: Track MTTR by incident type and severity. You'll often find that certain categories of incidents take disproportionately longer to resolve—and those are your highest-value improvement targets.
Planned downtime—scheduled maintenance, upgrades, migrations—can be timed for low-traffic windows and communicated in advance. Customers and employees know what to expect, and support teams aren't caught off guard.
Unplanned downtime is a different story. It strikes without warning, often during peak hours, and catches teams scrambling for context. The cost per minute of unplanned downtime typically runs 2-3x higher than planned downtime because of the chaos factor: slower response, confused stakeholders, and reactive communication.
Understanding what causes outages helps you prioritize prevention investments. While every environment is different, certain patterns appear consistently.
Misconfigurations, accidental deletions, and failed deployments remain leading causes of downtime. Manual processes increase risk—every handoff is an opportunity for something to go wrong.
Hardware failures, network outages, and software bugs account for a significant share of incidents. Aging infrastructure and accumulated technical debt compound the risk over time.
Ransomware, DDoS attacks, and data breaches force systems offline and create dual costs: the downtime itself plus breach remediation, notification requirements, and potential regulatory penalties.
When teams operate across disconnected monitoring, ITSM, and communication tools, critical alerts get missed or delayed. Slow handoffs between systems extend MTTR and multiply downtime cost. Unified platforms that consolidate detection, response, and communication provide a measurable advantage here.
Moving from understanding cost to reducing it requires operational changes, not just better math.
Fragmented tools create handoff delays. A unified workflow from alert to resolution eliminates context-switching and accelerates response. Teams using platforms that connect ITSM and incident management see faster resolution because responders aren't hunting for information across systems.
Alert fatigue slows response. AI-powered correlation groups related alerts and suppresses duplicates so teams can focus on incidents that actually require attention.
Slow escalation extends MTTR. Smart routing ensures the right expert is engaged immediately based on service ownership, severity, and availability—not just whoever happens to be next in a rotation.
Stakeholder confusion during outages creates additional support load. Automated status pages keep internal and external audiences informed without requiring responders to pause and write updates manually.
Skipping postmortems means repeating mistakes. Automated timeline reconstruction and blameless postmortem templates turn every incident into a reliability improvement opportunity.
Free Analyst Report: Unlock EMA's Findings on Faster, Smarter Incident Response
The connection between incident management maturity and downtime cost is direct: faster detection and resolution means shorter outages and lower total cost.
Modern platforms use AI to reduce noise and surface actionable incidents faster. When your monitoring tools generate thousands of alerts daily, correlation engines that group related signals and suppress duplicates can cut alert volume significantly—meaning responders spend time on real problems, not noise.
Unified workflows eliminate tool-switching and handoff delays. War rooms, runbooks, and ChatOps integrations keep everyone working from the same context instead of piecing together information from five different systems.
Automation captures incident context in real time, enabling faster resolution during the incident and better learning afterward. When postmortems write themselves from actual event data, teams are more likely to complete them—and continuous improvement compounds reliability gains over time.
Calculating downtime cost isn't the end goal—it's the starting point for building a business case. When you can show leadership that a 30-minute reduction in MTTR saves a specific dollar amount per incident, conversations about platform consolidation and automation investments become much easier.
Use your downtime cost calculation to prioritize where to focus: which incident types cost the most, which systems have the highest exposure, and which process improvements offer the fastest payback. Reliability isn't a destination. It's an operational discipline that compounds over time.
Most vendors will tell you ITSM implementation takes six months to a year — but modern, configuration-first platforms have rewritten the math entirely. See what real implementations look like in 2026, and why a long rollout is now a choice, not a given.


.webp)