




Blog
Insights & updates from our experts


Resolve plant floor and IT issues before they disrupt production.

Stay audit-ready while resolving issues and reducing operational risk.
Resolve issues quickly with an AI-powered system that automates ticketing.
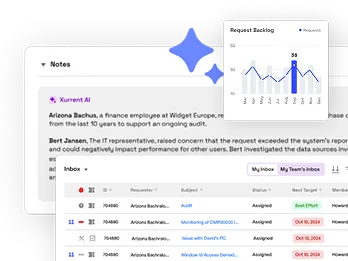
Unifiy IT, HR, Facilities, Finance, and more on a single, AI-powered service platform.
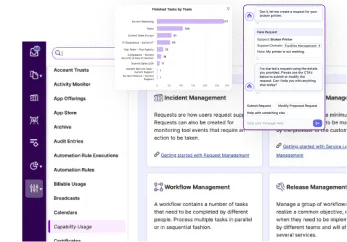
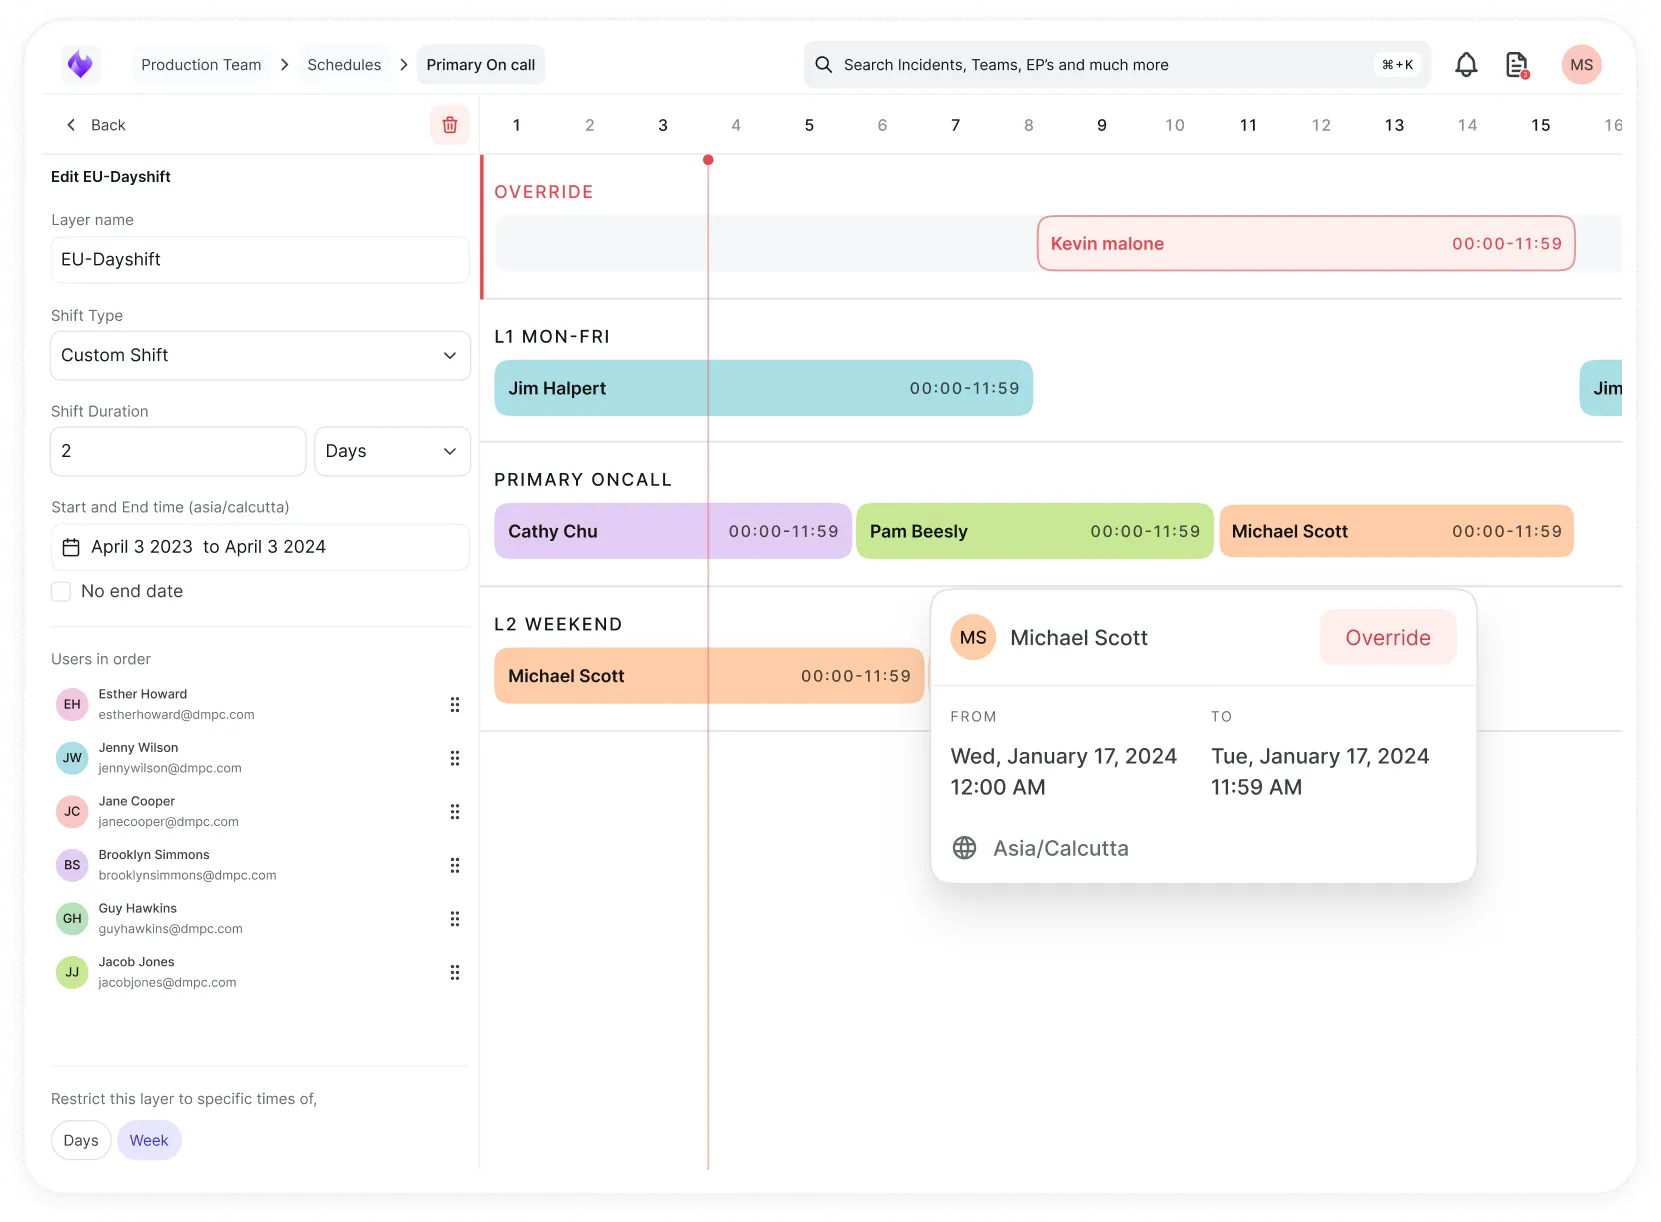
Simplify on-call scheduling, automate escalations, and reduce burnout.
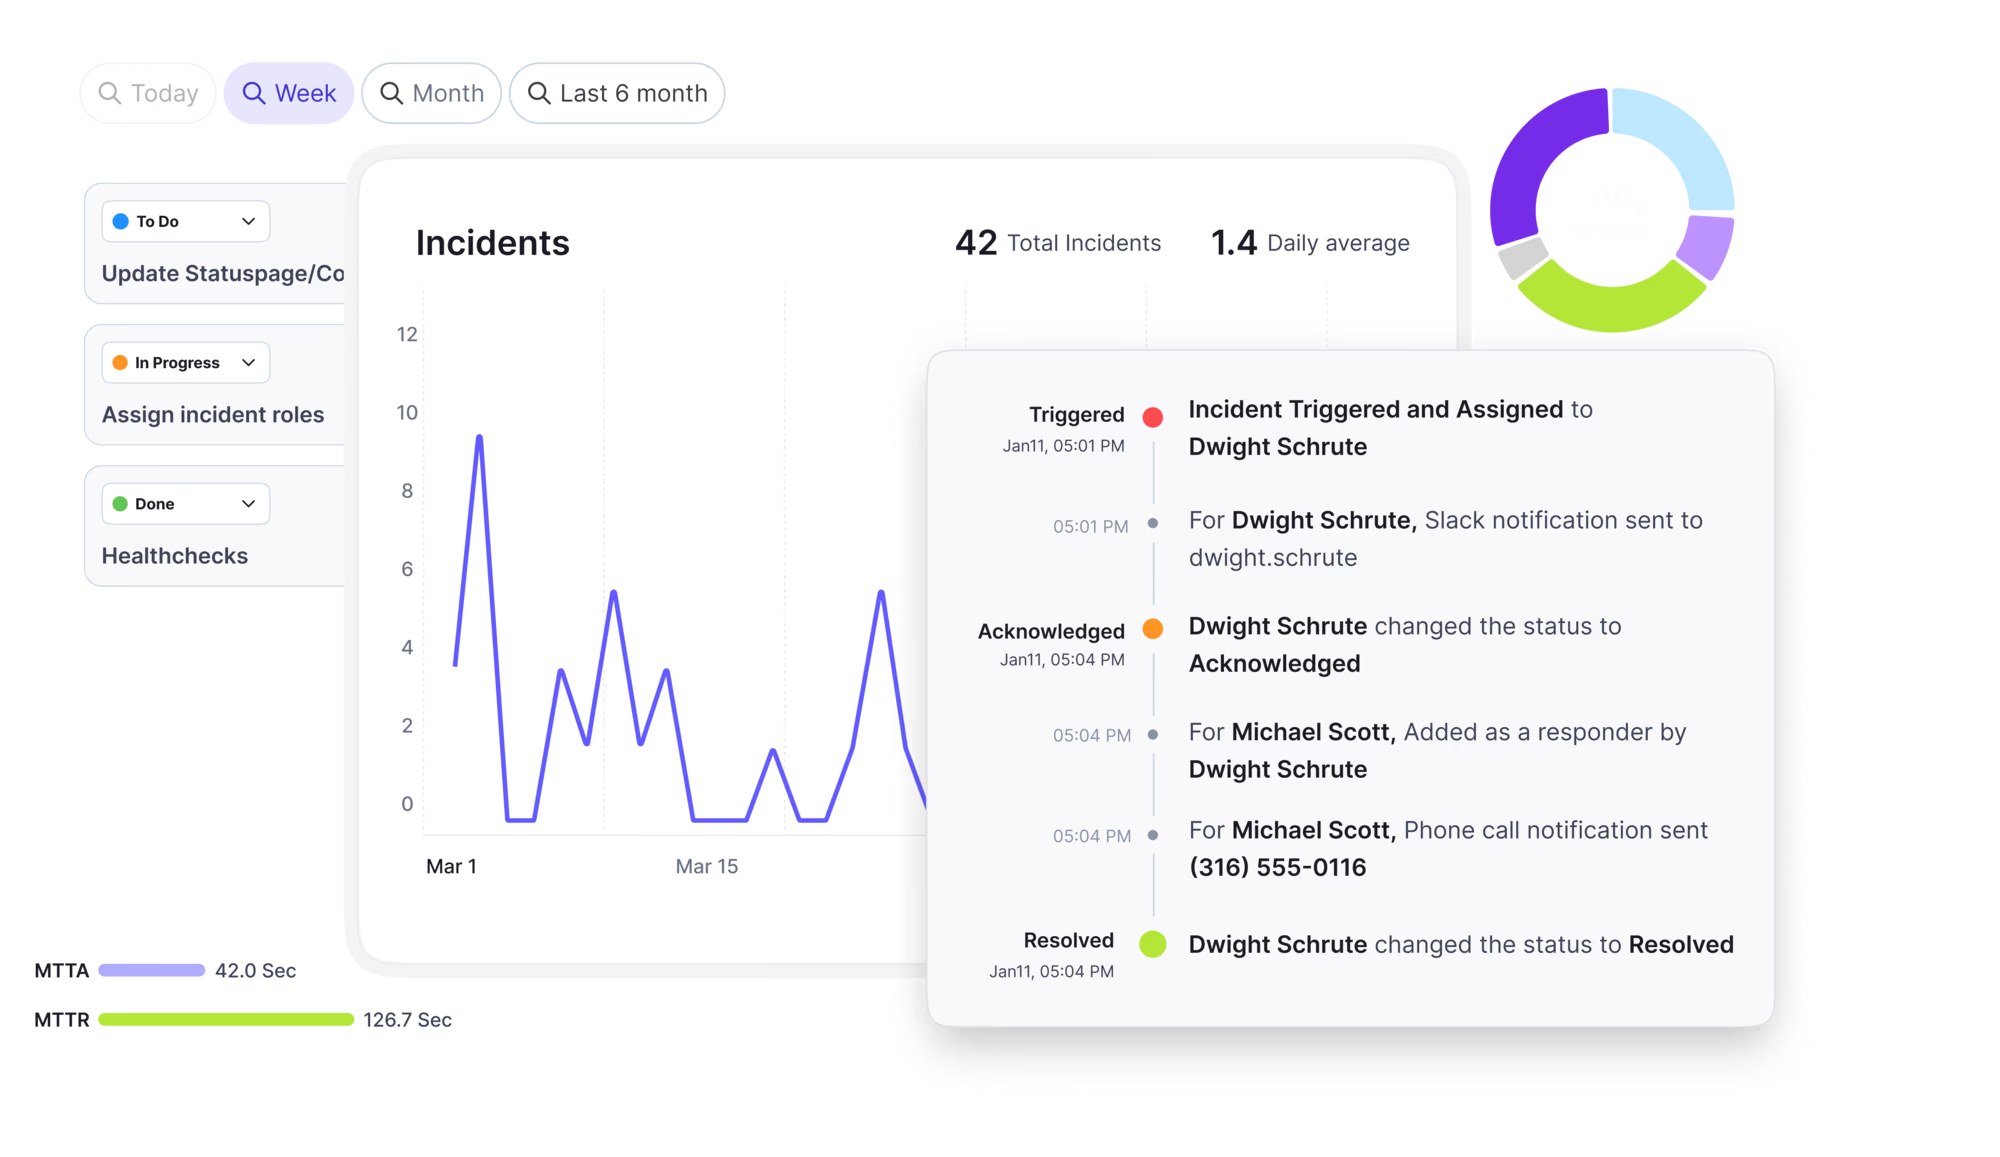
Automate postmortems, AI summaries, and post-incident workflows
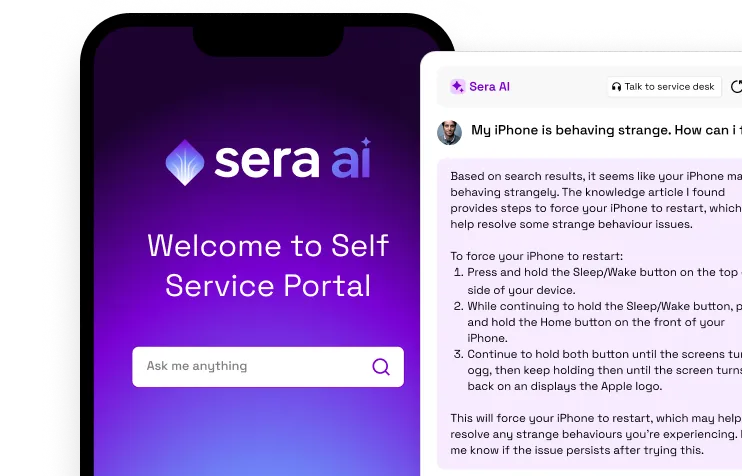
Create, organize, and continuously improve your knowledge base to find the right answers with Sera AI.
We're here to help

The integration with Atlassian Jira using the Xurrent Integration Service is

The integration with Atlassian Jira using the Xurrent Integration Service is

The integration with Atlassian Jira using the Xurrent Integration Service is

The integration with Atlassian Jira using the Xurrent Integration Service is

The integration with Atlassian Jira using the Xurrent Integration Service is

The integration with Atlassian Jira using the Xurrent Integration Service is

The integration with Atlassian Jira using the Xurrent Integration Service is

The integration with Atlassian Jira using the Xurrent Integration Service is
Resolve issues quickly with an AI-powered system that automates ticketing.
Unifiy IT, HR, Facilities, Finance, and more on a single, AI-powered service platform.
Simplify on-call scheduling, automate escalations, and reduce burnout.
Automate postmortems, AI summaries, and post-incident workflows
Create, organize, and continuously improve your knowledge base to find the right answers with Sera AI.
Resolve plant floor and IT issues before they disrupt production.
Stay audit-ready while resolving issues and reducing operational risk.

Detect, respond, and resolve incidents fast to cut downtime and MTTR.

Keep your store online, even during your biggest sales moments.

Protect patient data and resolve issues fast, so care teams stay focused on care.

Standardize service delivery across every store and channel.

We are here to help 24/7

Connect with other Xurrent Users

Get insights and tips on how to get the most out of Xurrent

Apps, APIs, and updates

Xurrent service functionality

Eliminate manual tasks, optimize workflows, and deliver faster resolutions.
Learn how organizations have reduced downtime, improved 50% MTTA & MTTR, and cut costs with Xurrent IMR.
Discover Xurrent IMR's quick support, bidirectional integrations with Jira and Slack, and more cohesive incident response capabilities compared to Opsgenie.
Understand why users value Xurrent IMR for its intuitive interface, efficient incident alerting, customizable On-call schedules, and escalations.
This post is a living document, and we’ll keep adding new updates right here until the quarter ends on September 31st.
A pod restarts once. A 5xx spike clears before anyone opens a laptop. A latency probe blips at 3am and is gone by the time the page is acknowledged.
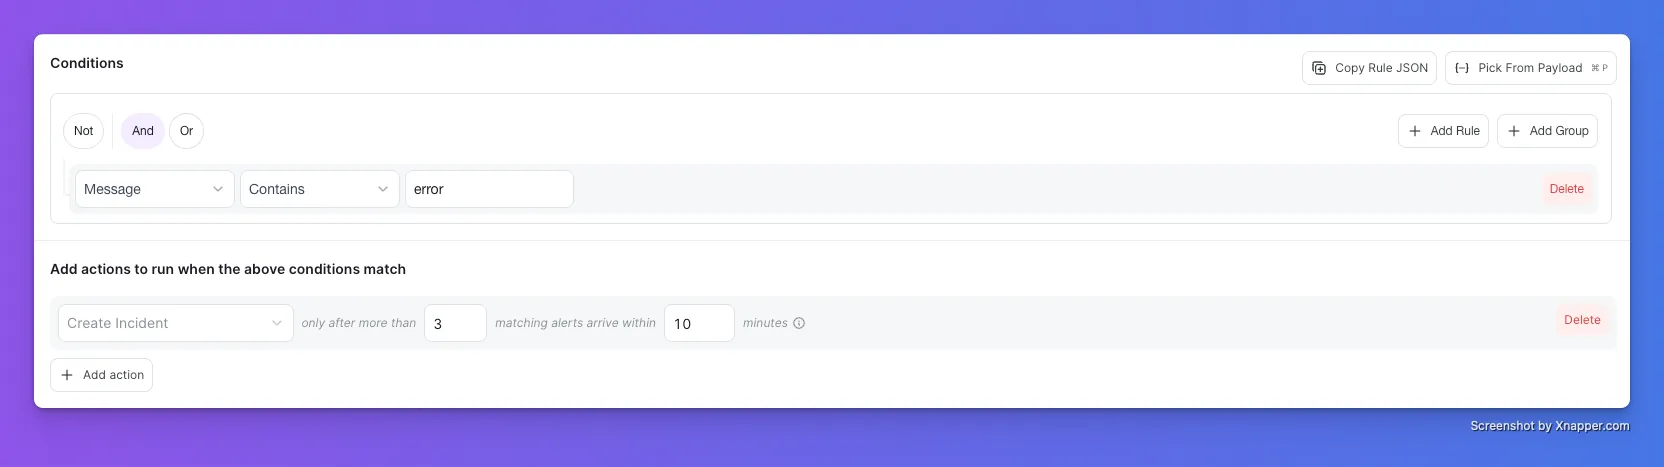
Set a count and a time window on a Create Incident action. Matching alerts are held silently until the count is crossed inside that window. When it is, IMR opens one incident and pages the on-call responder, and every later alert attaches to that same incident.
If the window closes without the count being reached, the held alerts stay silent and nobody is paged.
Available on all accounts. Set it on any existing alert rule. Nothing changes in what your monitoring tools send.
Alert Rules → Create Incident → Set a threshold
A backup script emails an OK when it finishes. A vendor batch sends a nightly confirmation. The report you only notice when it doesn't arrive.
Heartbeats can now be pinged by email as well as by URL. Give the heartbeat an address and a subject filter, and any matching email counts as a ping. If the expected email stops arriving inside the interval you set, IMR opens an incident on the associated service and pages the on-call responder.
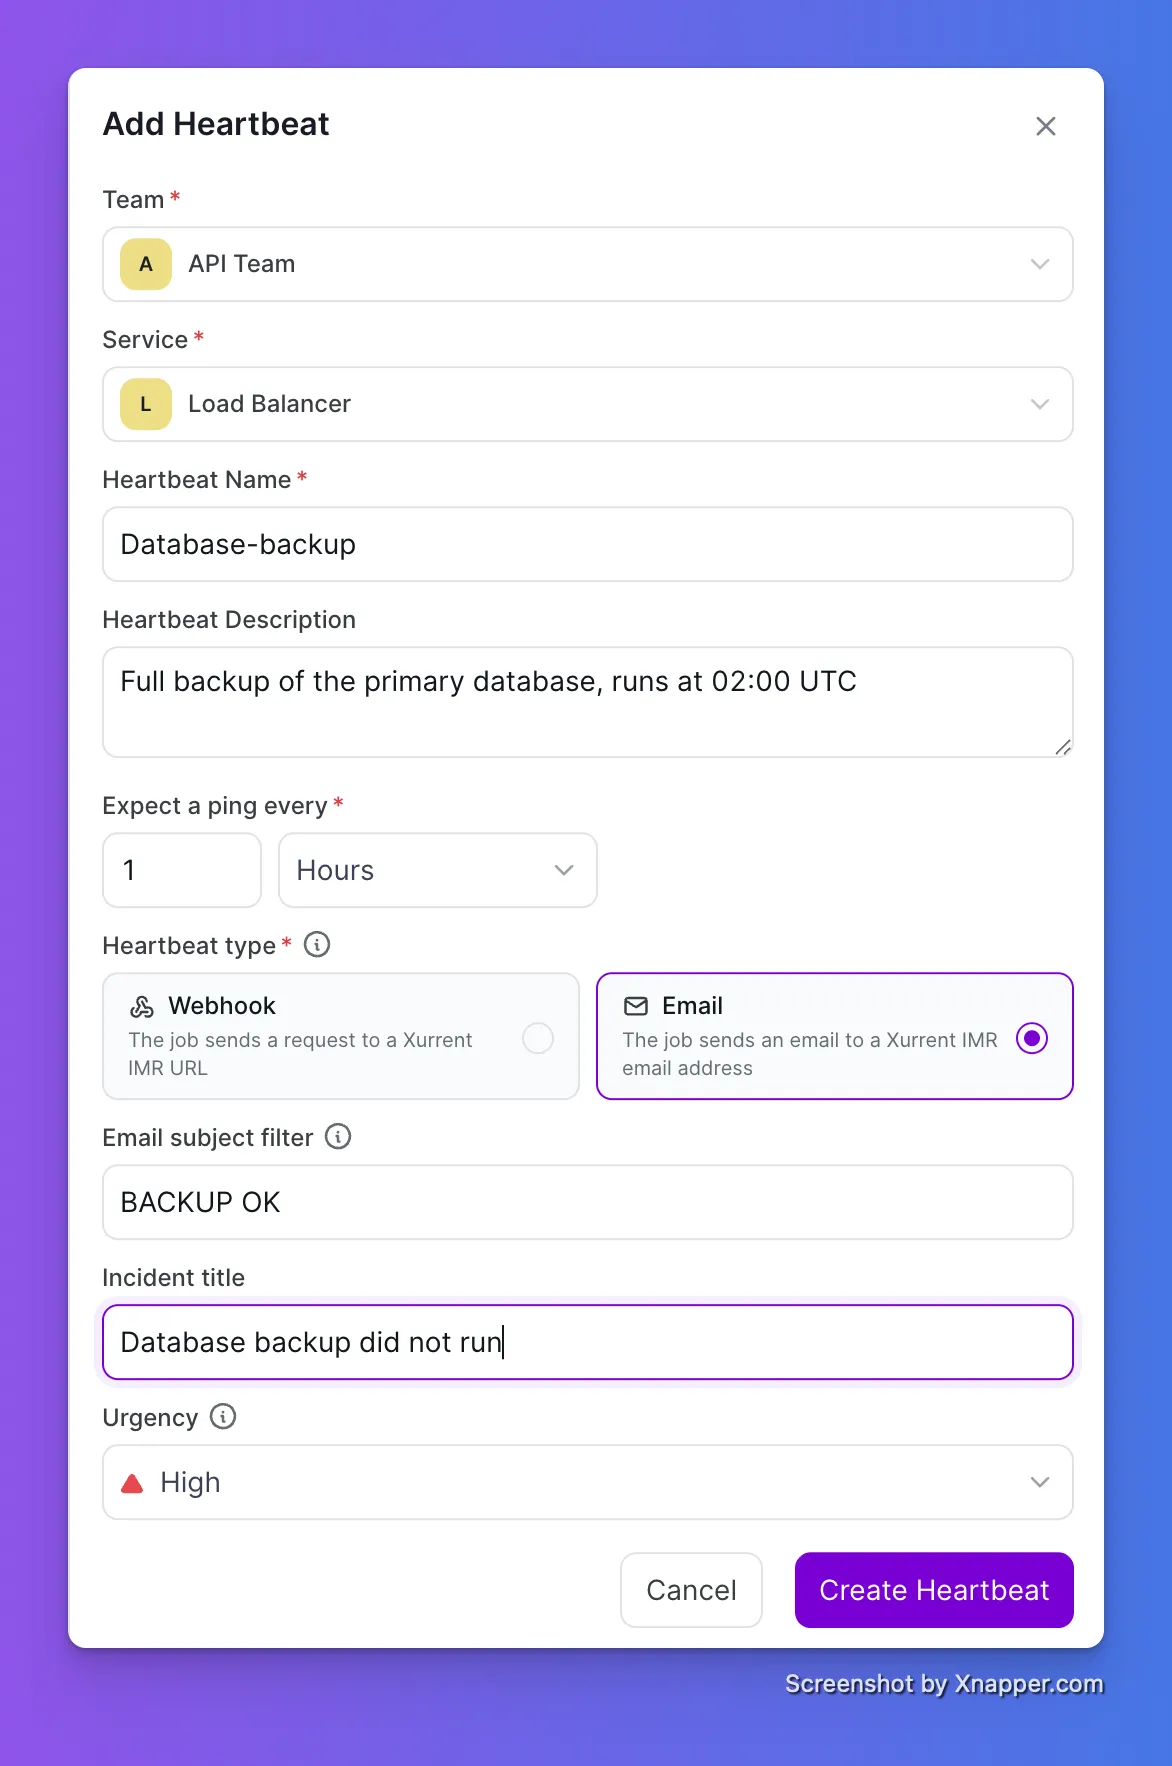
When matching emails resume, the incident resolves itself. Nothing to close manually.
Existing URL heartbeats keep working as they are. Available on all accounts.
Account Settings → Heartbeat
Most production incidents start with a change. A deploy, a config update, a pull request merged an hour before things broke. Finding it usually means someone drops out of the incident channel to scroll commit history while the clock runs.
Sera's Root Cause Agent can now connect to GitHub and read recent pull requests and deploys. When a change lines up with the incident timeline, the agent names it in the root cause hypothesis and references the specific commit.
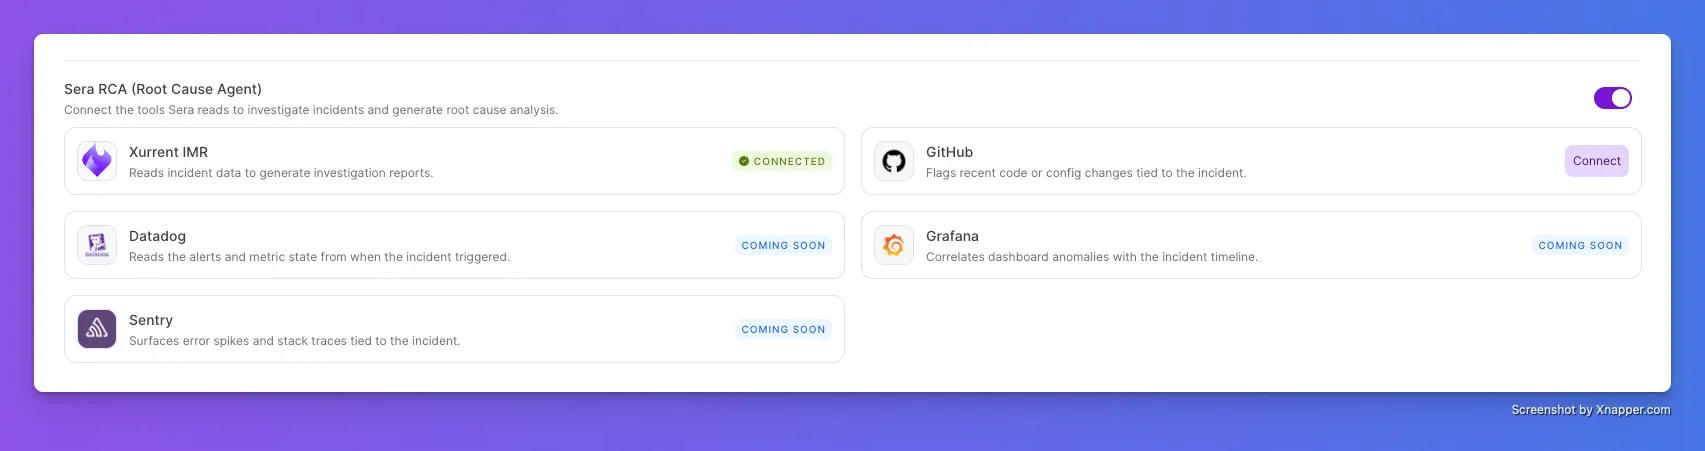
Read access only. The agent reads your history, it never writes to it and it never pages on its own.
Connect the repositories you want it to look at. The more sources it can read, the higher its confidence.
Integrations → GitHub →
Incident calls move fast. Keeping stakeholders updated shouldn’t mean pulling a responder away from troubleshooting.
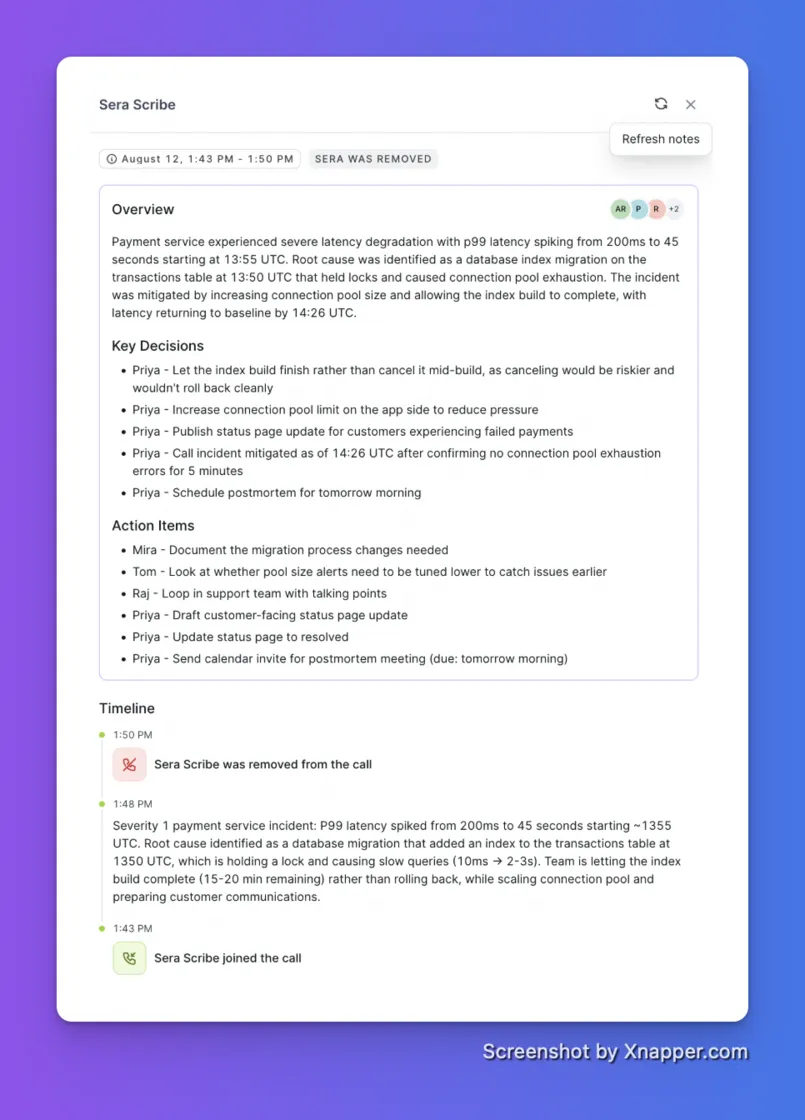
With Sera Scribe, Sera automatically joins your Zoom or Microsoft Teams incident call when a meeting link is attached to an incident. It transcribes the conversation and turns it into structured incident updates, including:
Updates can be posted automatically to your incident Slack channel every 5, 10, 15, or 20 minutes, or you can choose a single wrap-up summary at the end of the call.
If a sensitive discussion comes up, any responder can remove Sera from the call at any time.
Get started: Account → Customisation → Enable Sera Scribe
Escalations can quickly become a hidden source of on-call fatigue. Until now, it wasn’t easy to see how many calls each person actually received across an incident’s escalation chain.
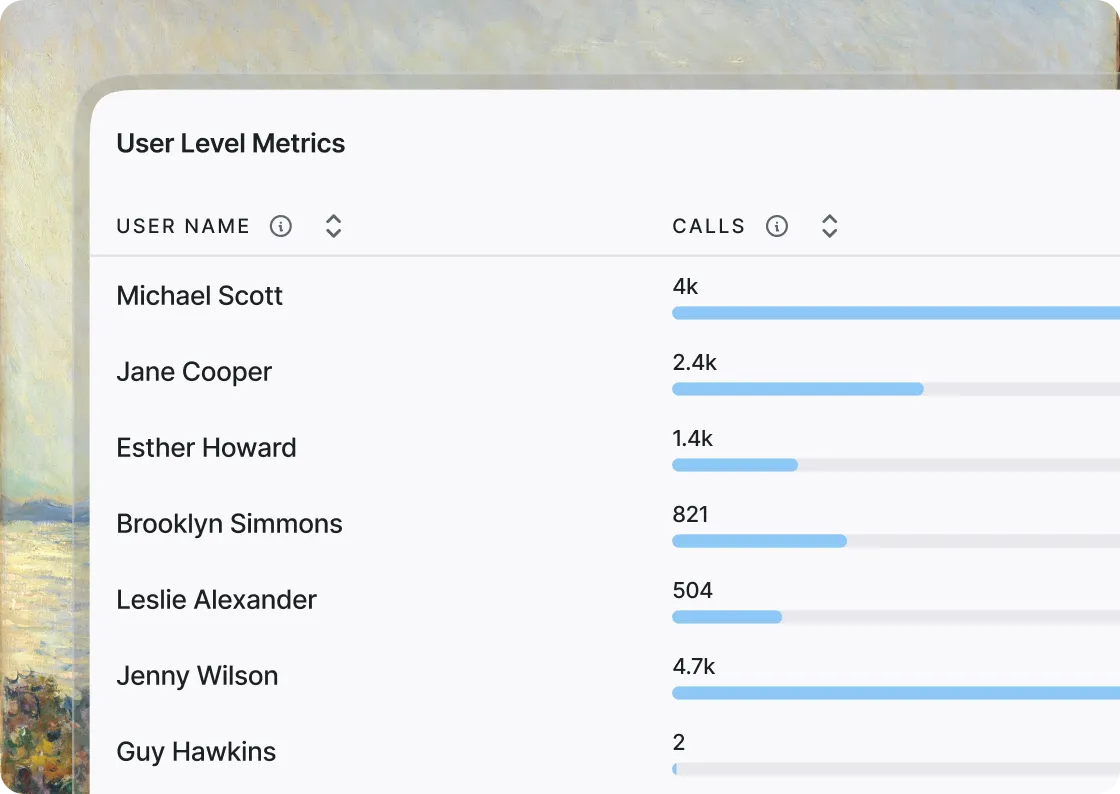
The new Calls column in Users Analytics shows the total number of phone calls received by each user across the full escalation chain—not just the person who eventually acknowledged the incident.
Use your existing filters for team, service, priority, and time period to identify escalation patterns.
For example, filter for P0 incidents for a specific team and see whether senior engineers are repeatedly receiving escalation calls. That can be a useful signal that your first-line escalation policy needs tuning.
Call data is available from August 15, 2026 onwards.
Not every failure generates an alert.
Cron jobs, database backups, and data pipelines can simply stop running and you may not discover the problem until hours later.
Heartbeat monitors these silent jobs by expecting a periodic ping from your job. If the ping doesn’t arrive within the configured interval, Xurrent IMR automatically creates an incident on the associated service and pages your on-call team.
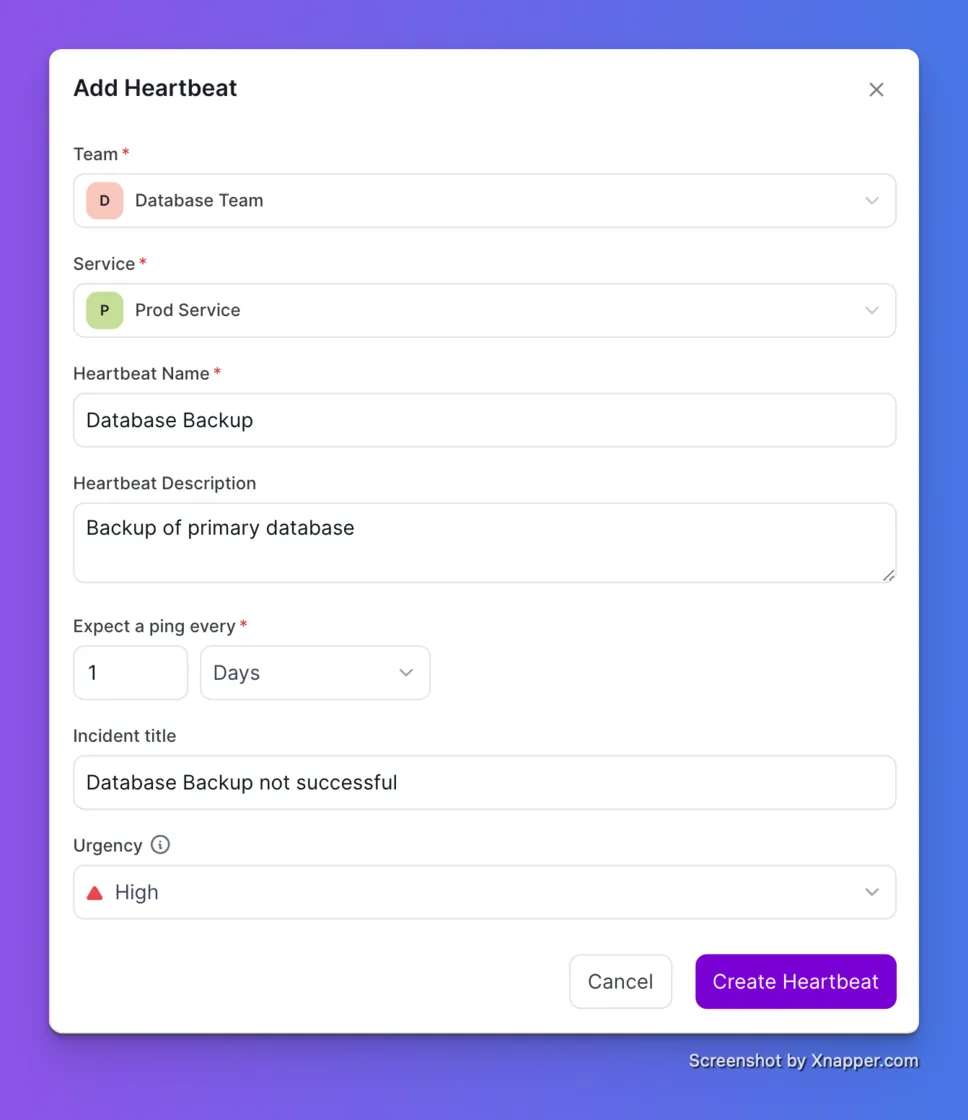
When the job starts running again, the incident resolves automatically.
There’s no custom integration required. Attach a heartbeat directly to a service and add a simple ping to your cron job or scheduled process.
Get started: Account Settings → Heartbeat
Every metric in Analytics used to be a mean. And means lie when incident data is skewed. One 10-day outage quietly drags your MTTR up. A handful of auto-resolved blips drag it down. The number you report to leadership stops matching what your on-call engineers actually lived through.
You can now switch any metric between Mean, P75, P95, and P99 from the aggregation dropdown. Total Incidents, MTTA, MTTR, all of it.
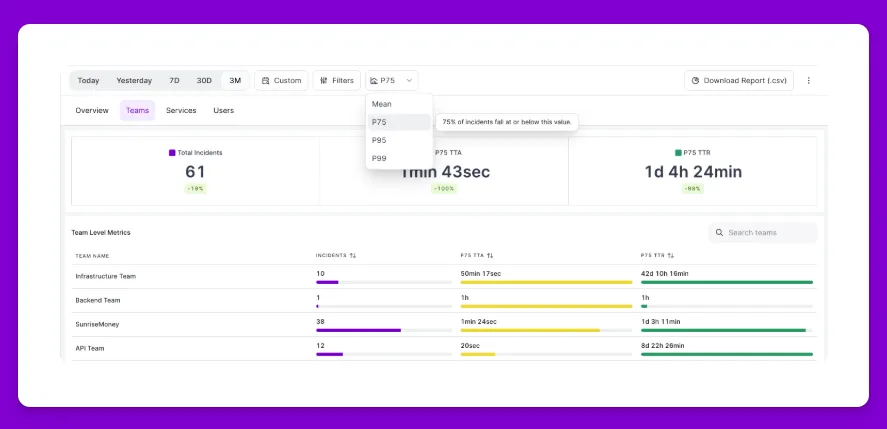
Want the resolution time 95% of incidents actually fall under? That's P95.
Percentiles work across Overview, Teams, Services, and Users. Now you can read a team's MTTA and MTTR the same way you'd read request latency in your observability stack: by the tail, not the average.
A Security incident needs CVE IDs and compliance frameworks. A Sev0 outage needs blast radius, customer impact, and a war room link. Forcing both into the same rigid form means responders capture too little, right when detail matters most.
The new Custom Incident Form lets you decide what gets captured for each kind of incident. Define custom fields once (Impact Summary, CVE ID, Region Affected, Revenue Impact, anything your team tracks), then group them into incident types like Alert, Security Incident, or Major Incident.
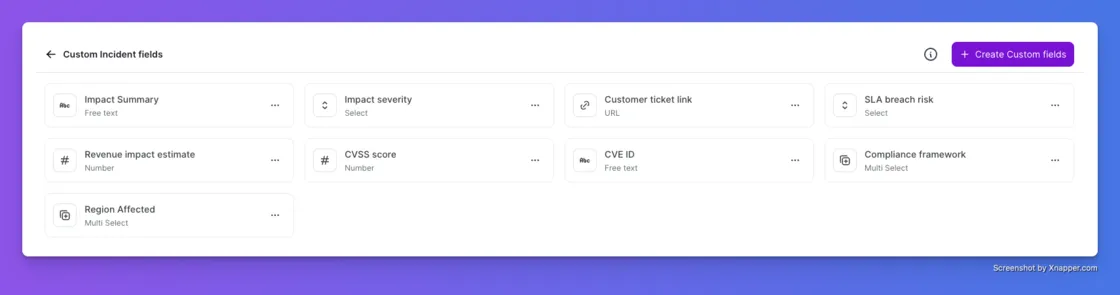
Responders pick a type at creation. The form reshapes on the spot.
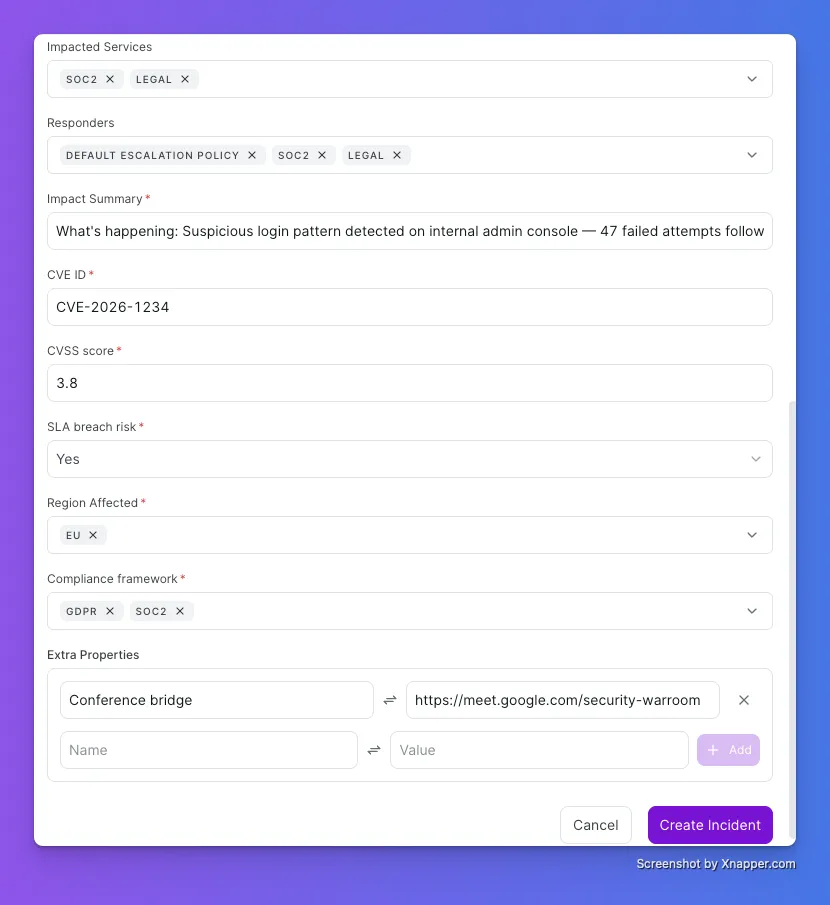
Head to Account Settings > Custom Incident Form to set it up.
When an incident hits, the clock starts and so does the scramble. Digging through dashboards. Scrolling old Slack threads. Trying to remember if you've seen this before.
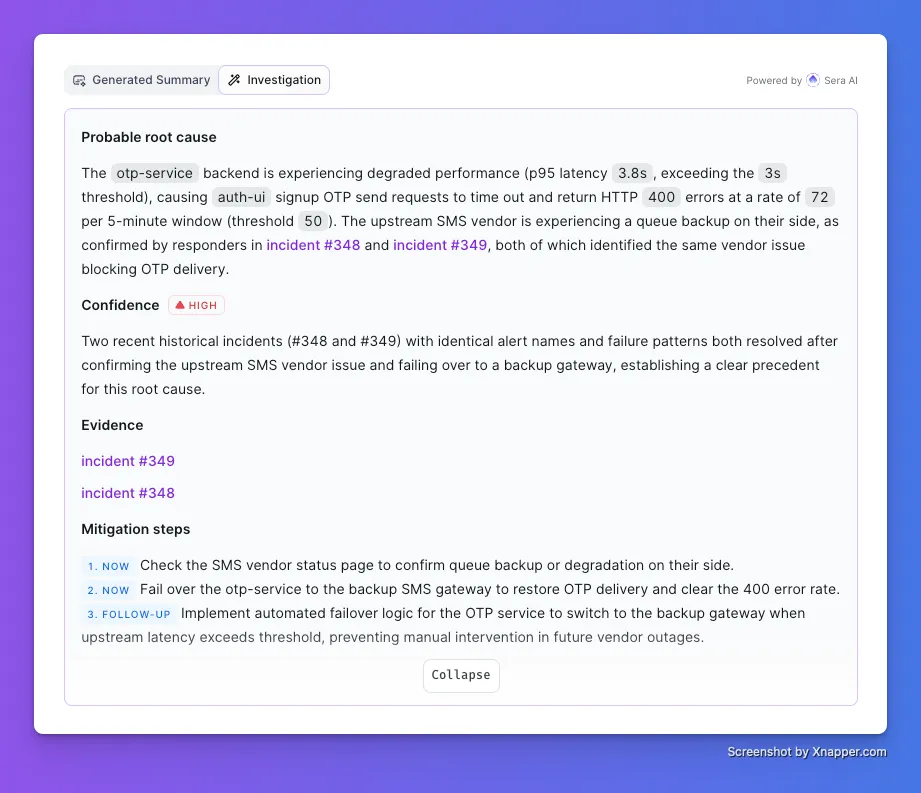
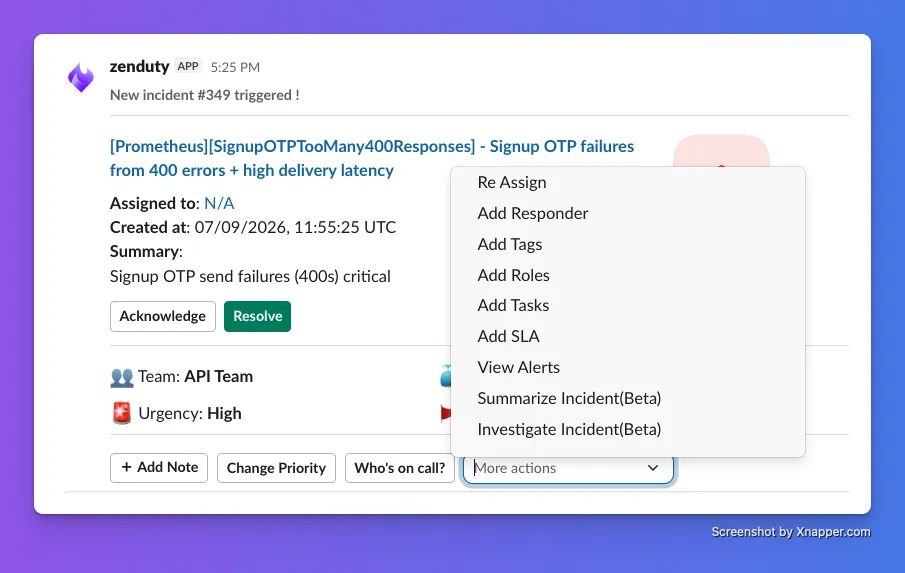
Sera's new Root Cause Hypothesis Agent does that investigation for you. Open any incident, click Investigate (or trigger it right from the incident's Slack channel). Within seconds, Sera returns:
Sera works by reading your alert payload, finding the most similar past incidents your team has resolved, and pulling the postmortems and Slack threads from those. Signal from your own history, surfaced when you need it.
Sera's about to get sharper.
GitHub. Sera will cross-reference recent PRs and deploys against the incident timeline, so you'll know if a code or config change is the likely culprit.
Datadog, Grafana, Sentry. Connect your observability stack and every investigation gets richer signal to work from.


.webp)
.webp)
.webp)