.webp)

Blog
Insights & updates from our experts
Resolve issues quickly with an AI-powered system that automates ticketing.

Resolve issues quickly with an AI-powered system that automates ticketing.

Resolve issues quickly with an AI-powered system that automates ticketing.

Resolve issues quickly with an AI-powered system that automates ticketing.
Resolve issues quickly with an AI-powered system that automates ticketing.

Resolve issues quickly with an AI-powered system that automates ticketing.

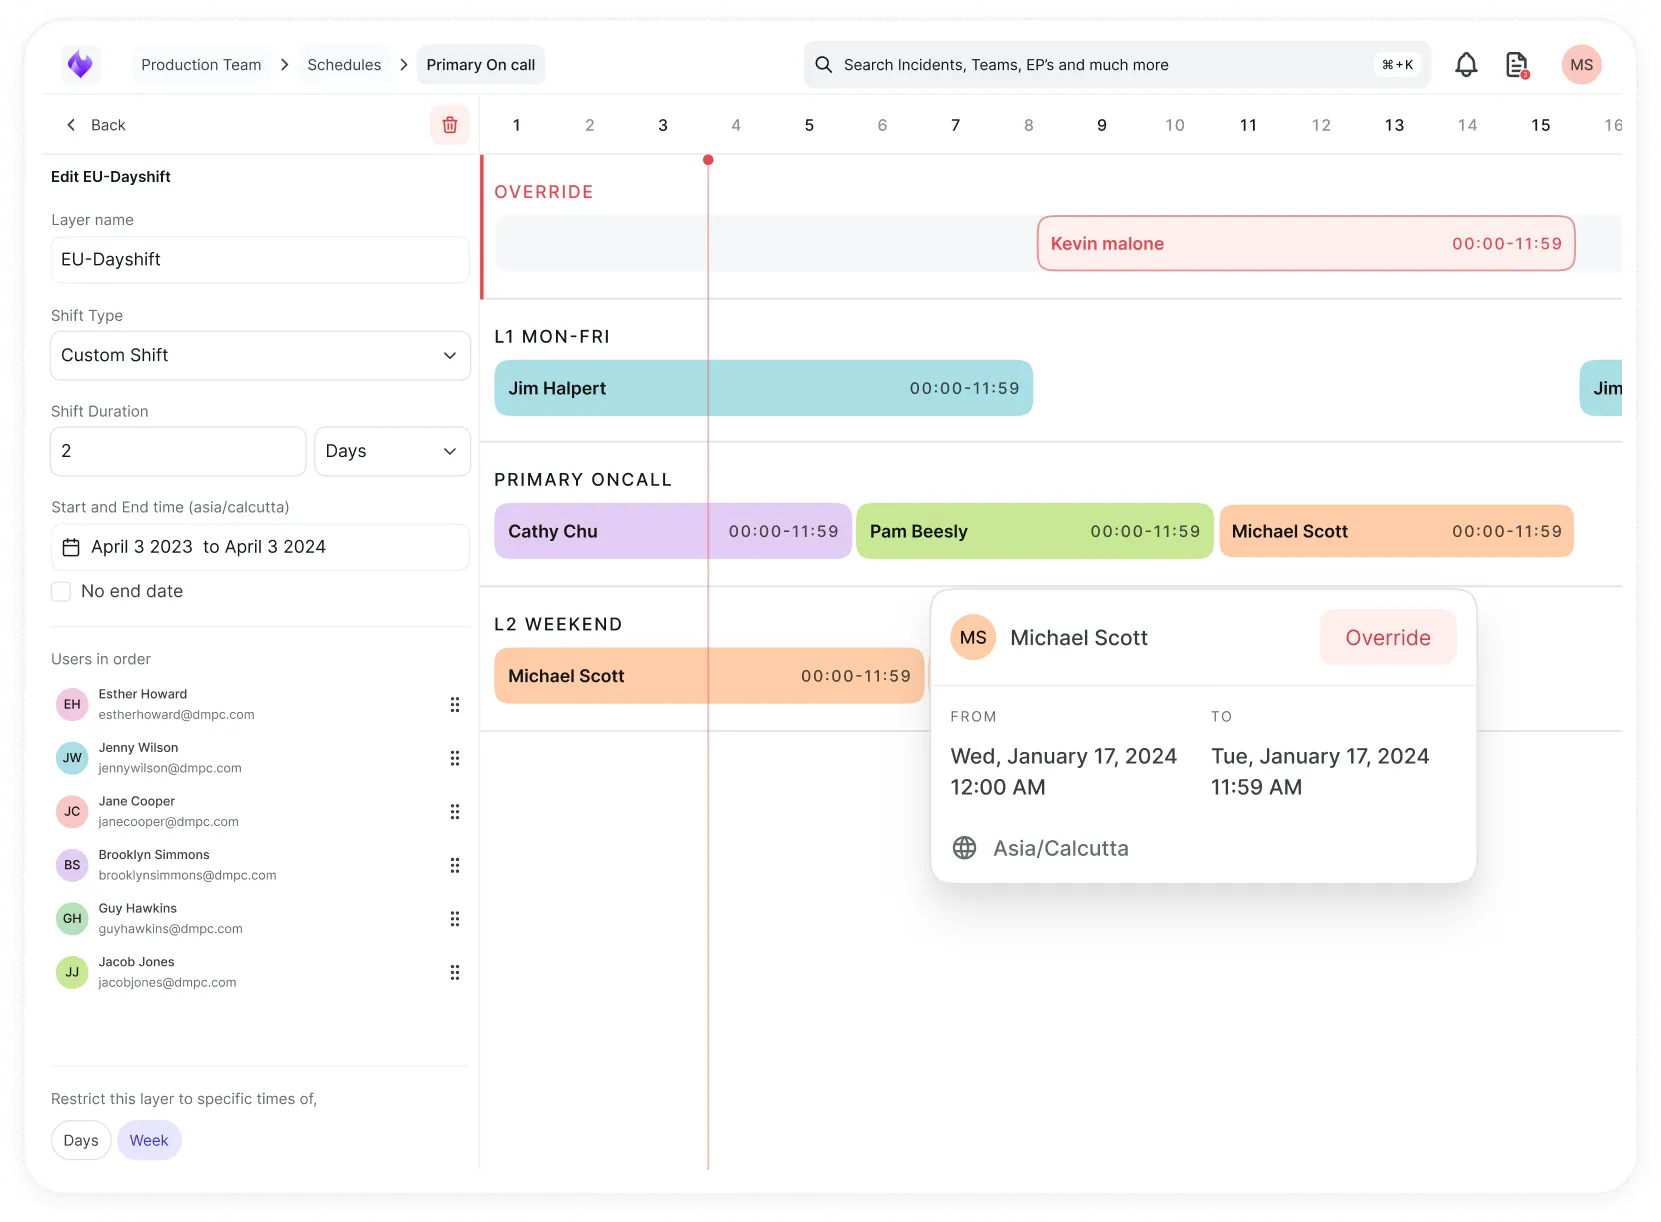
Simplify on-call scheduling, automate escalations, and reduce burnout.
Automate postmortems, AI summaries, and post-incident workflows
We're here to help

The integration with Atlassian Jira using the Xurrent Integration Service is

The integration with Atlassian Jira using the Xurrent Integration Service is

The integration with Atlassian Jira using the Xurrent Integration Service is

The integration with Atlassian Jira using the Xurrent Integration Service is

The integration with Atlassian Jira using the Xurrent Integration Service is

The integration with Atlassian Jira using the Xurrent Integration Service is

The integration with Atlassian Jira using the Xurrent Integration Service is

The integration with Atlassian Jira using the Xurrent Integration Service is
Resolve issues quickly with an AI-powered system that automates ticketing.
Resolve issues quickly with an AI-powered system that automates ticketing.
Simplify on-call scheduling, automate escalations, and reduce burnout.
Automate postmortems, AI summaries, and post-incident workflows
Resolve issues quickly with an AI-powered system that automates ticketing.
Resolve issues quickly with an AI-powered system that automates ticketing.
Resolve issues quickly with an AI-powered system that automates ticketing.
Resolve issues quickly with an AI-powered system that automates ticketing.

We are here to help 24/7

Connect with other Xurrent Users

Get insights and tips on how to get the most out of Xurrent

Apps, APIs, and updates

Xurrent service functionality
Eliminate manual tasks, optimize workflows, and deliver faster resolutions.
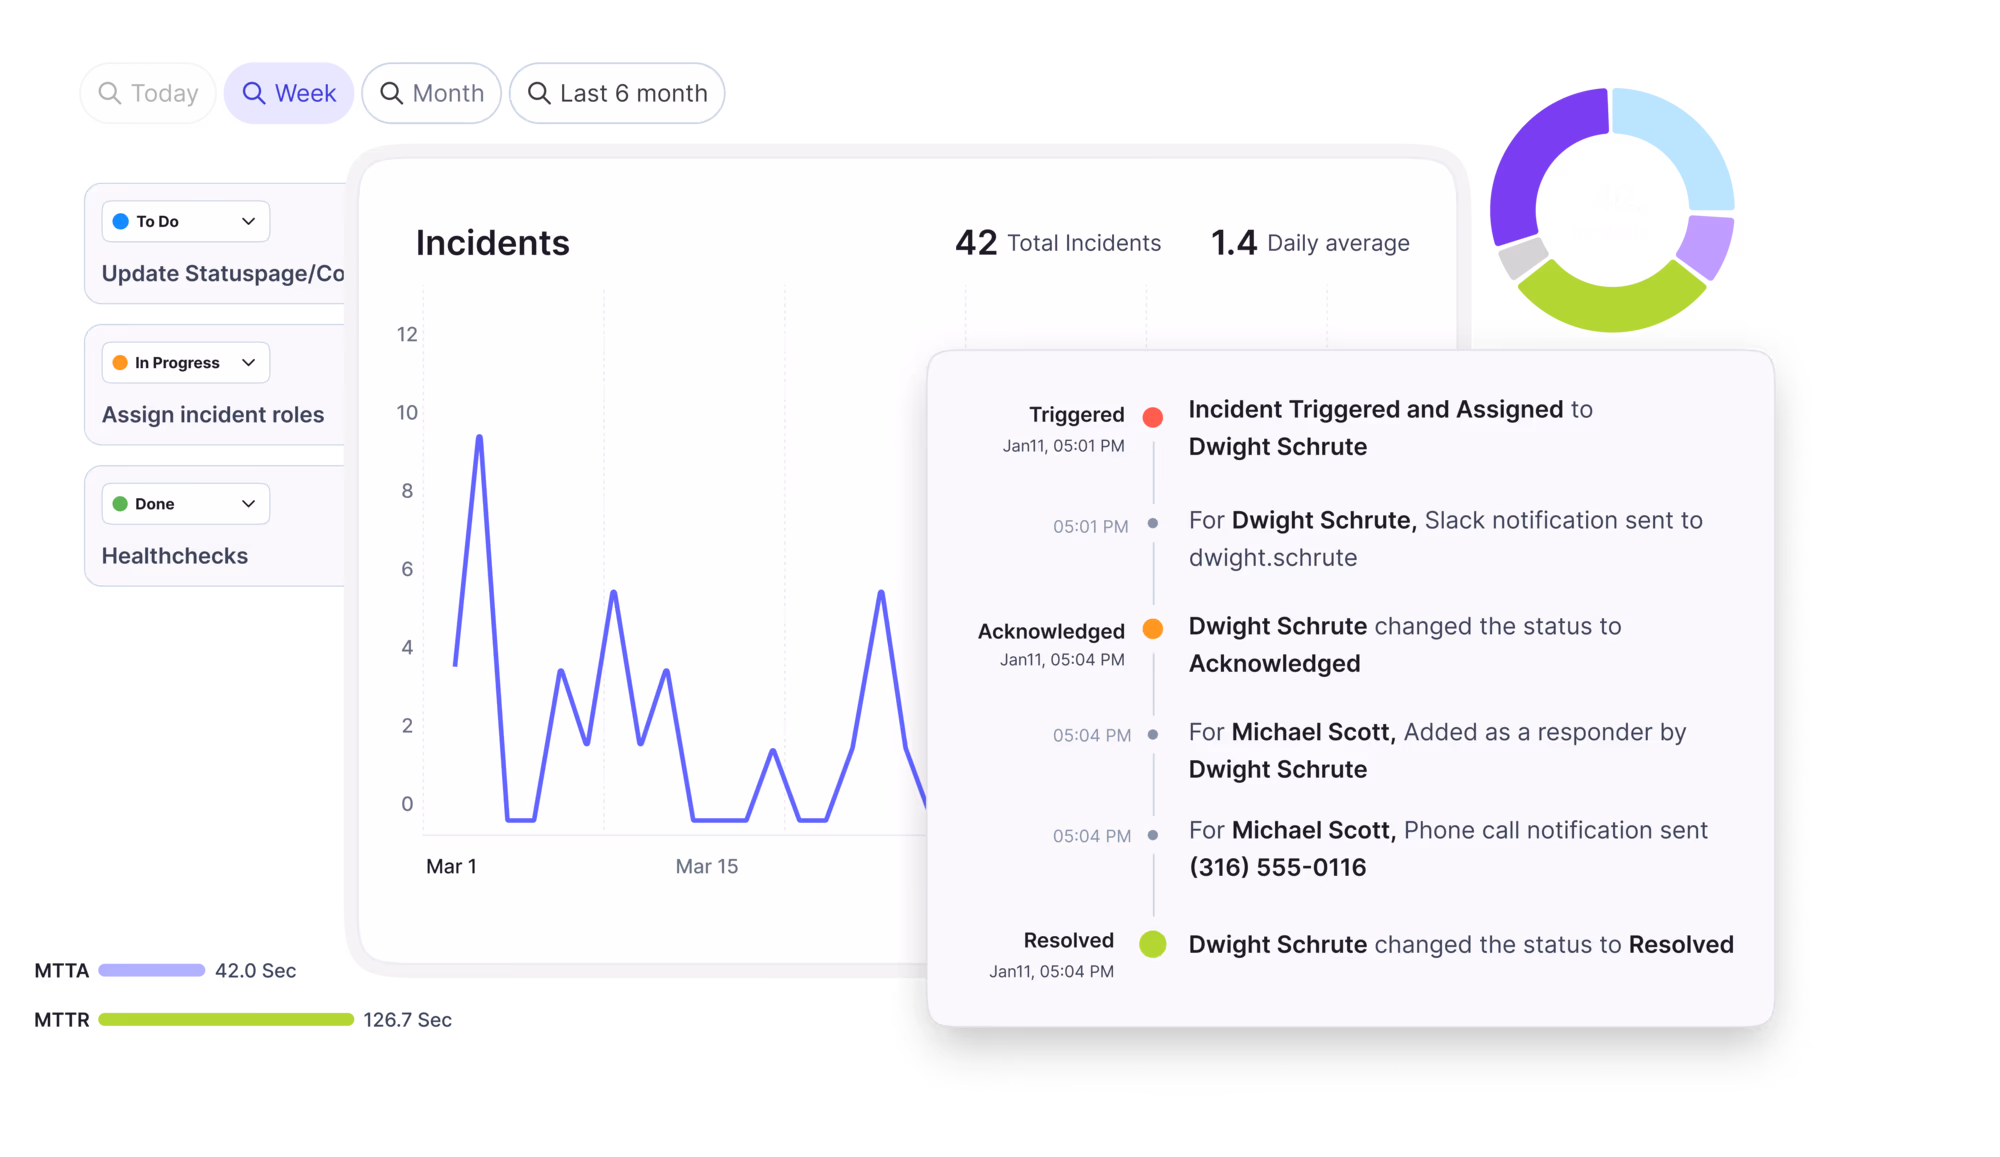
Learn how organizations have reduced downtime, improved 50% MTTA & MTTR, and cut costs with Xurrent IMR.
Discover Xurrent IMR's quick support, bidirectional integrations with Jira and Slack, and more cohesive incident response capabilities compared to Opsgenie.
Understand why users value Xurrent IMR for its intuitive interface, efficient incident alerting, customizable On-call schedules, and escalations.
A Digital Twin is a virtual representation of a physical system, asset, or process that uses real-time data to mirror its operational state, performance, and behavior. In enterprise IT and operations management, digital twins create live, data-driven models of infrastructure components, applications, services, or entire environments, enabling teams to monitor health, simulate changes, predict failures, and optimize performance without touching production systems. Unlike static documentation or configuration snapshots, a digital twin continuously ingests telemetry from sensors, monitoring tools, and operational data sources to maintain an accurate, up-to-date reflection of the physical counterpart it represents.
Digital twins originated in manufacturing and industrial IoT but have expanded into IT operations, where they model servers, network topology, application dependencies, and service delivery chains. The twin synchronizes with its physical counterpart through APIs, agents, and integrations with CMDB, observability platforms, and ITSM tools, creating a single source of truth that spans configuration, performance metrics, incident history, and change records.
Digital twins enable proactive operations by surfacing issues before they cause incidents. When a twin detects anomalies—such as degraded performance, configuration drift, or capacity thresholds—it can trigger alerts, auto-remediation workflows, or predictive maintenance tasks, reducing MTTR and preventing outages. For change management, teams can test proposed changes against the digital twin to assess impact, validate dependencies, and identify risks without disrupting live services, improving change success rates and minimizing rollback scenarios.
In incident response, digital twins provide responders with complete operational context: current state, recent changes, dependency maps, and historical performance trends. This accelerates root cause analysis and reduces time spent gathering information across fragmented tools. For capacity planning and optimization, twins simulate load scenarios, forecast resource needs, and identify underutilized assets, supporting data-driven decisions that balance cost and performance.
Organizations that lack digital twin capabilities rely on manual discovery, outdated documentation, and reactive troubleshooting, leading to longer incident resolution times, higher change failure rates, and increased operational risk. Digital twins shift IT operations from reactive firefighting to predictive, simulation-driven management.
A digital twin is built by integrating data from multiple operational sources into a unified model. The process begins with discovery and mapping: agents, APIs, and integrations pull configuration data from CMDBs, asset inventories, and infrastructure-as-code repositories to establish the baseline structure of the system being modeled. This includes servers, applications, network devices, dependencies, and relationships.
Real-time telemetry feeds continuously update the twin with live operational data. Monitoring tools, observability platforms, log aggregators, and APM systems stream metrics such as CPU utilization, memory consumption, transaction latency, error rates, and availability status. The twin correlates this telemetry with configuration data to reflect current operational state.
Analytics and simulation engines layer intelligence on top of the model. Machine learning algorithms detect anomalies, predict failures, and recommend optimizations. Simulation capabilities allow teams to model "what-if" scenarios: testing configuration changes, capacity adjustments, or failover procedures against the twin before applying them to production.
Integration with ITSM and incident management platforms closes the loop. When the twin detects an issue, it can automatically create incidents, trigger runbooks, or escalate alerts to on-call teams. Post-incident, the twin captures state changes and resolution steps, feeding continuous improvement and preventing recurrence.
- Data center infrastructure management : A global financial services firm maintains a digital twin of its hybrid cloud environment, modeling on-premises servers, network switches, storage arrays, and public cloud instances. The twin ingests real-time telemetry from Datadog, ServiceNow CMDB, and AWS CloudWatch, enabling the infrastructure team to simulate disaster recovery scenarios, forecast capacity needs, and validate network segmentation changes before deployment, reducing change-related incidents by 40%.
- Application service modeling : A SaaS provider creates digital twins of its microservices architecture, mapping service dependencies, API call patterns, and database connections. When the twin detects latency spikes in a downstream service, it automatically correlates the issue with recent deployments, identifies affected upstream services, and routes an incident to the responsible SRE team with full context, cutting MTTR from 45 minutes to under 15 minutes.
- Facilities and IoT operations : A manufacturing enterprise uses digital twins to model HVAC systems, power distribution, and environmental sensors across production facilities. The twin predicts equipment failures based on vibration patterns and temperature trends, triggering preventive maintenance work orders in the ITSM platform before breakdowns occur, improving uptime by 25% and reducing emergency repair costs.
- CMDB (Configuration Management Database)
- AIOps (Artificial Intelligence for IT Operations)
- Monitoring and Event Management
- Incident Management
- Change Enablement (Management)
---

.webp)
.webp)