.webp)


Blog
Insights & updates from our experts
Resolve issues quickly with an AI-powered system that automates ticketing.

Resolve issues quickly with an AI-powered system that automates ticketing.

Resolve issues quickly with an AI-powered system that automates ticketing.

Resolve issues quickly with an AI-powered system that automates ticketing.
Resolve issues quickly with an AI-powered system that automates ticketing.

Resolve issues quickly with an AI-powered system that automates ticketing.

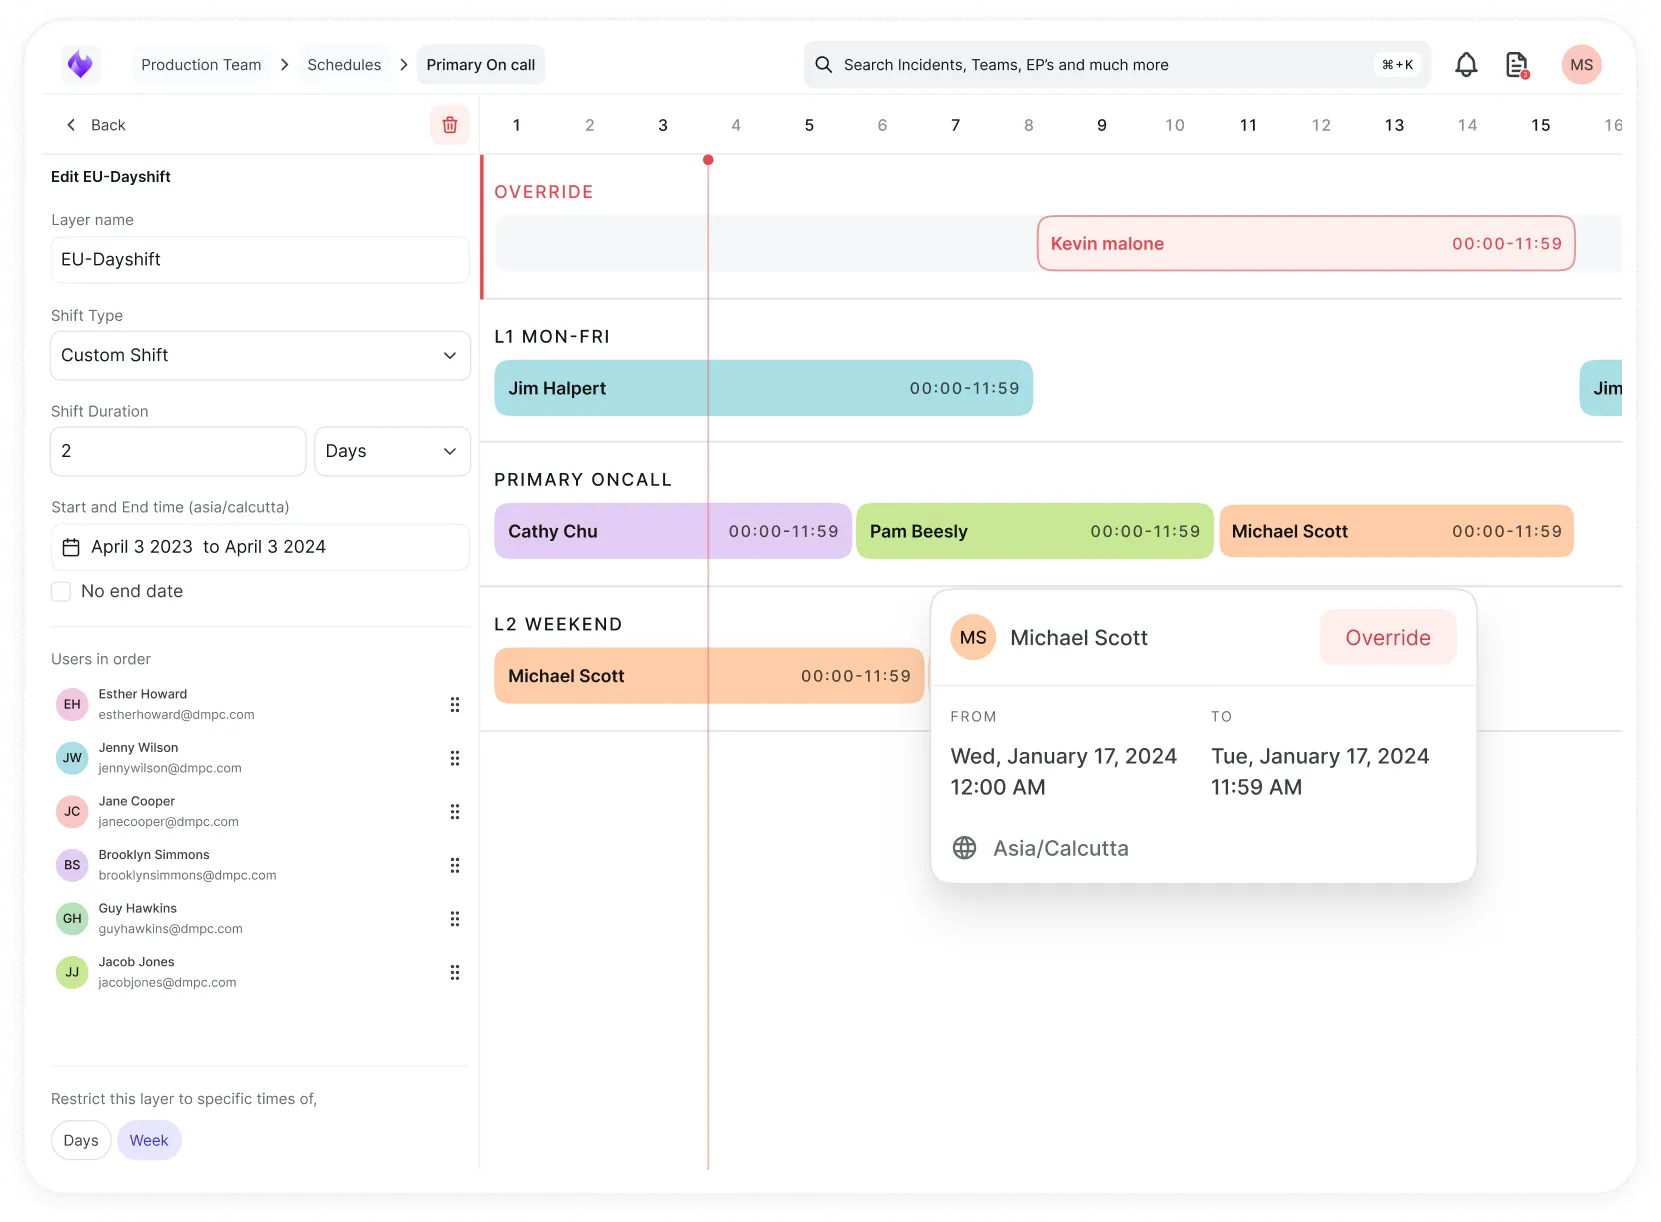
Simplify on-call scheduling, automate escalations, and reduce burnout.
Automate postmortems, AI summaries, and post-incident workflows
We're here to help

The integration with Atlassian Jira using the Xurrent Integration Service is

The integration with Atlassian Jira using the Xurrent Integration Service is

The integration with Atlassian Jira using the Xurrent Integration Service is

The integration with Atlassian Jira using the Xurrent Integration Service is

The integration with Atlassian Jira using the Xurrent Integration Service is

The integration with Atlassian Jira using the Xurrent Integration Service is

The integration with Atlassian Jira using the Xurrent Integration Service is

The integration with Atlassian Jira using the Xurrent Integration Service is
Resolve issues quickly with an AI-powered system that automates ticketing.
Resolve issues quickly with an AI-powered system that automates ticketing.
Simplify on-call scheduling, automate escalations, and reduce burnout.
Automate postmortems, AI summaries, and post-incident workflows
Resolve issues quickly with an AI-powered system that automates ticketing.
Resolve issues quickly with an AI-powered system that automates ticketing.
Resolve issues quickly with an AI-powered system that automates ticketing.
Resolve issues quickly with an AI-powered system that automates ticketing.

We are here to help 24/7

Connect with other Xurrent Users

Get insights and tips on how to get the most out of Xurrent

Apps, APIs, and updates

Xurrent service functionality
Eliminate manual tasks, optimize workflows, and deliver faster resolutions.
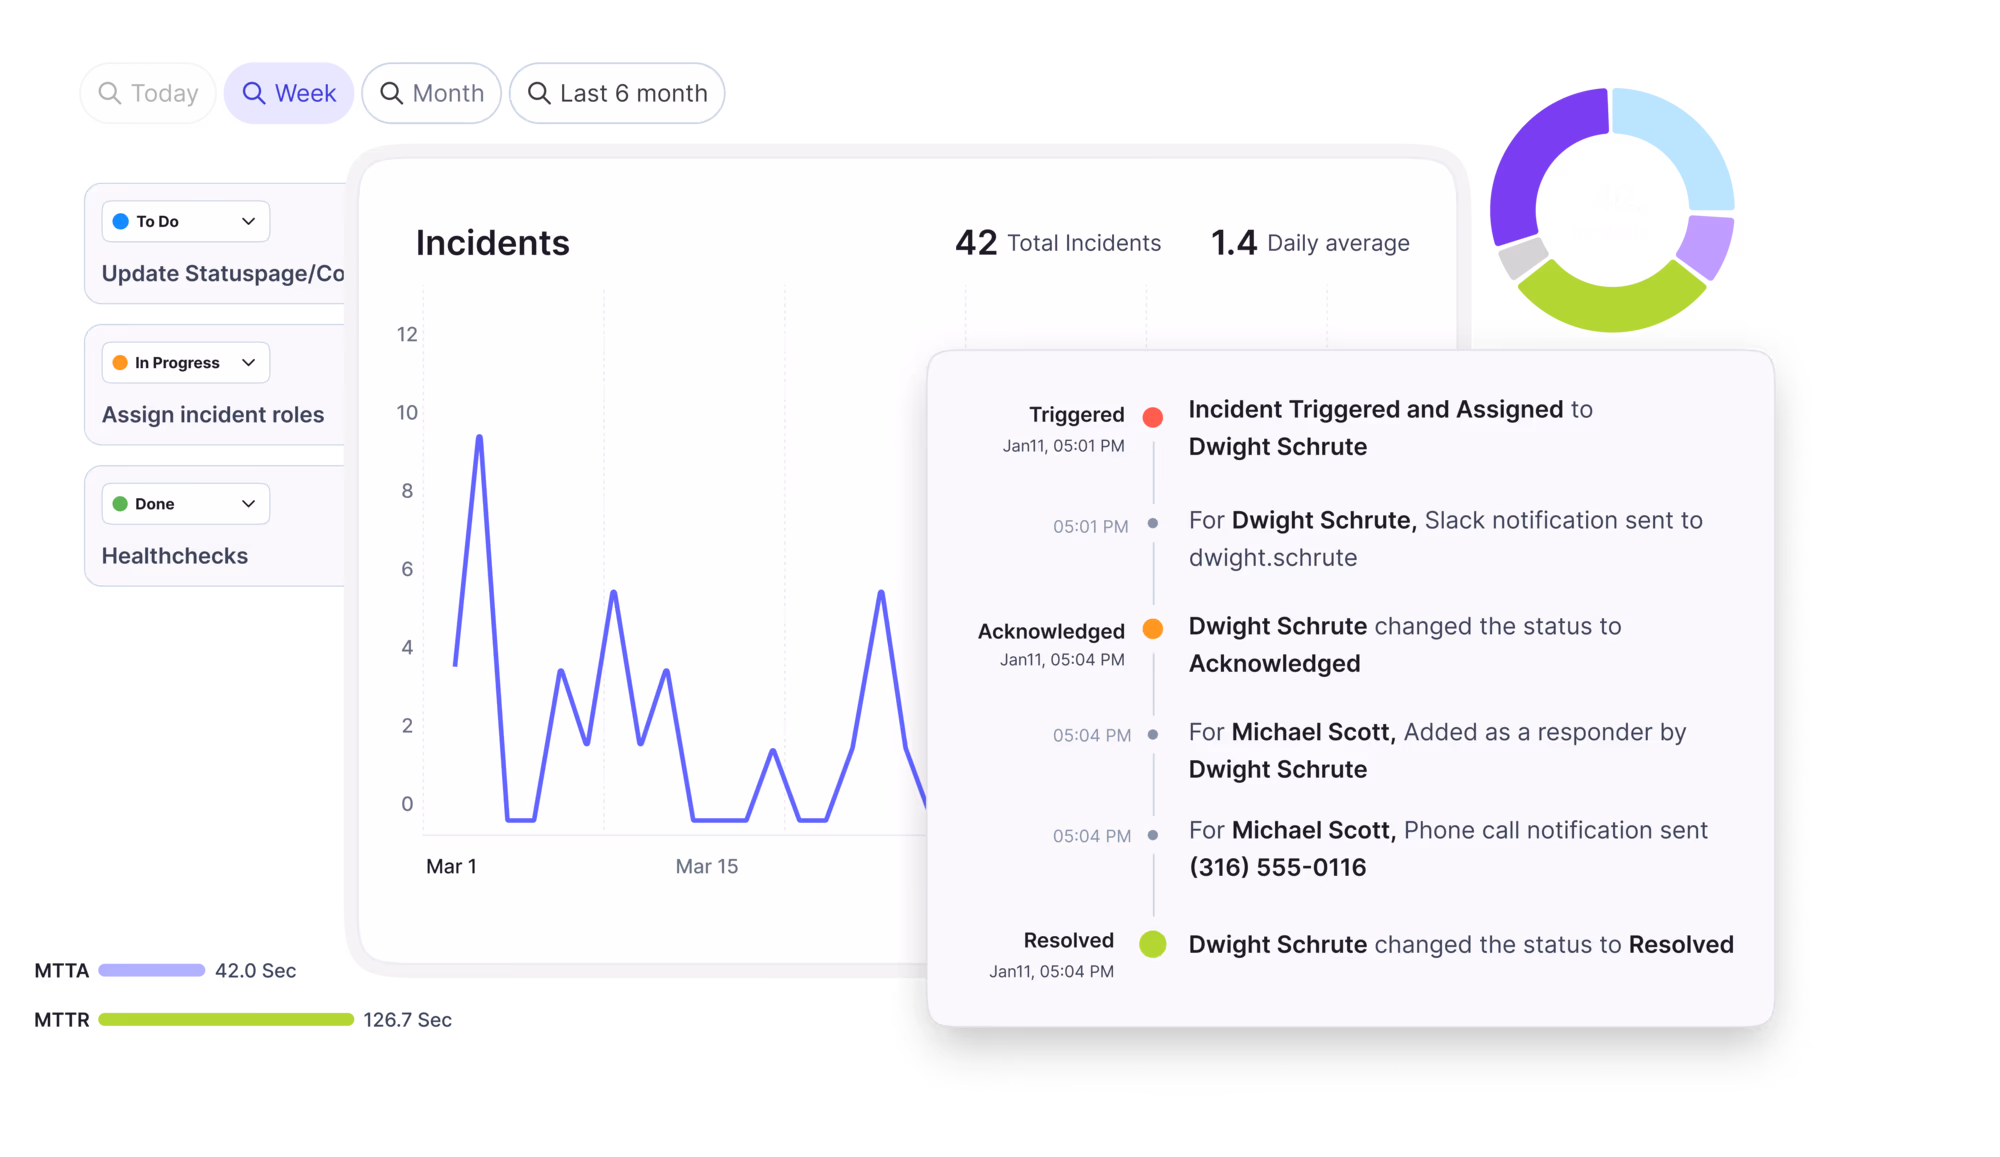
Learn how organizations have reduced downtime, improved 50% MTTA & MTTR, and cut costs with Xurrent IMR.
Discover Xurrent IMR's quick support, bidirectional integrations with Jira and Slack, and more cohesive incident response capabilities compared to Opsgenie.
Understand why users value Xurrent IMR for its intuitive interface, efficient incident alerting, customizable On-call schedules, and escalations.
Monitoring and Event Management is the ITIL practice that continuously observes IT infrastructure, applications, and services to detect, filter, and respond to events that could impact service availability or performance. An event is any detectable change in state—a server reaching CPU threshold, a failed transaction, a successful backup, or a security alert—and Monitoring and Event Management ensures that only meaningful events trigger action while routine state changes are logged without interruption. This practice operates across the entire IT estate, from on-premises data centers to cloud environments, collecting telemetry from monitoring tools, observability platforms, and application performance management (APM) systems, then correlating that data to determine whether human intervention is required.
The practice distinguishes between informational events (routine state changes), warning events (approaching thresholds that require attention), and exception events (service disruptions or failures requiring immediate response). Monitoring and Event Management feeds directly into Incident Management when exceptions occur, but its primary value lies in proactive detection—identifying degraded performance or capacity constraints before they escalate into user-impacting incidents. In modern IT operations, this practice integrates with AIOps platforms that apply machine learning to reduce alert noise, correlate events across distributed systems, and automatically trigger remediation workflows.
Monitoring and Event Management is the operational foundation for service reliability. Without continuous observation and intelligent event filtering, IT teams operate reactively—learning about outages from user complaints rather than automated alerts. Organizations that implement effective Monitoring and Event Management reduce Mean Time to Detect (MTTD) from hours to minutes, often catching performance degradation before it crosses the threshold into a service-impacting incident. This proactive stance directly improves uptime, protects revenue during peak transaction periods, and prevents SLA breaches that trigger financial penalties or erode customer trust.
The practice also controls operational costs by preventing alert fatigue. Monitoring tools generate thousands of events daily; without proper event management, on-call teams drown in noise, miss critical signals, and burn out from constant false alarms. Effective event correlation and suppression ensure responders receive only actionable alerts, improving response times and reducing the cognitive load on SRE and DevOps teams. For compliance-driven industries, Monitoring and Event Management provides the audit trail required to demonstrate continuous control over critical systems, supporting ISO 27001, SOC 2, and regulatory frameworks that mandate real-time security and availability monitoring.
Monitoring and Event Management operates through a continuous cycle of detection, filtering, correlation, and response. Monitoring tools—ranging from infrastructure monitors like Nagios and Datadog to application-level observability platforms like New Relic and Dynatrace—collect metrics, logs, and traces from across the IT environment. These tools generate events when predefined conditions are met: a disk exceeds 85% capacity, an API response time crosses 500ms, or a database connection pool exhausts available connections.
Once detected, events enter a filtering and correlation layer. Informational events (successful backups, routine reboots) are logged but do not trigger alerts. Warning events are routed to dashboards or queued for review during business hours. Exception events—service failures, security breaches, or threshold violations—are immediately escalated. Modern event management platforms use correlation rules to group related events: if ten application servers simultaneously report high CPU, the system recognizes a shared root cause rather than generating ten separate alerts.
The practice then determines the appropriate response. Automated responses handle known conditions—restarting a failed service, scaling cloud resources, or clearing temporary files. Events requiring human judgment are routed to Incident Management, creating a ticket, paging the on-call engineer, and attaching relevant context (recent changes, affected services, historical patterns). Post-event, the practice feeds data into Problem Management to identify recurring patterns and drive permanent fixes, and into Capacity Management to inform infrastructure planning.
- E-commerce platform during Black Friday : A retail company's monitoring system detects a 40% increase in database query latency at 6:00 AM, three hours before peak traffic. Event correlation identifies a scheduled batch job consuming excessive resources. The system automatically delays the job and alerts the database team, who tune query performance before the traffic surge. No customer-facing impact occurs, and the event is logged for post-holiday capacity review.
- Healthcare provider maintaining HIPAA compliance : A hospital's event management platform monitors access to electronic health records (EHR) systems. When an unusual pattern is detected—a user accessing 50 patient records in five minutes—the system generates a security exception event, locks the account, and alerts the security operations center. The event timeline, including all accessed records, is preserved for compliance audit and incident investigation.
- SaaS company managing microservices architecture : A software vendor runs 200 microservices across Kubernetes clusters. Monitoring detects that the payment service's error rate jumped from 0.1% to 5%. Event correlation links this to a recent deployment and elevated latency in a downstream authentication API. The system automatically rolls back the payment service deployment, pages the on-call SRE with full context, and creates an incident ticket linked to the change record—reducing MTTR from 45 minutes to 8 minutes.
- Incident Management
- AIOps (Artificial Intelligence for IT Operations)
- Problem Management
- ITOM (IT Operations Management)
- Service Level Management
---


.webp)
.webp)