




Blog
Insights & updates from our experts


Resolve plant floor and IT issues before they disrupt production.

Stay audit-ready while resolving issues and reducing operational risk.
Resolve issues quickly with an AI-powered system that automates ticketing.
Unifiy IT, HR, Facilities, Finance, and more on a single, AI-powered service platform.
Simplify on-call scheduling, automate escalations, and reduce burnout.
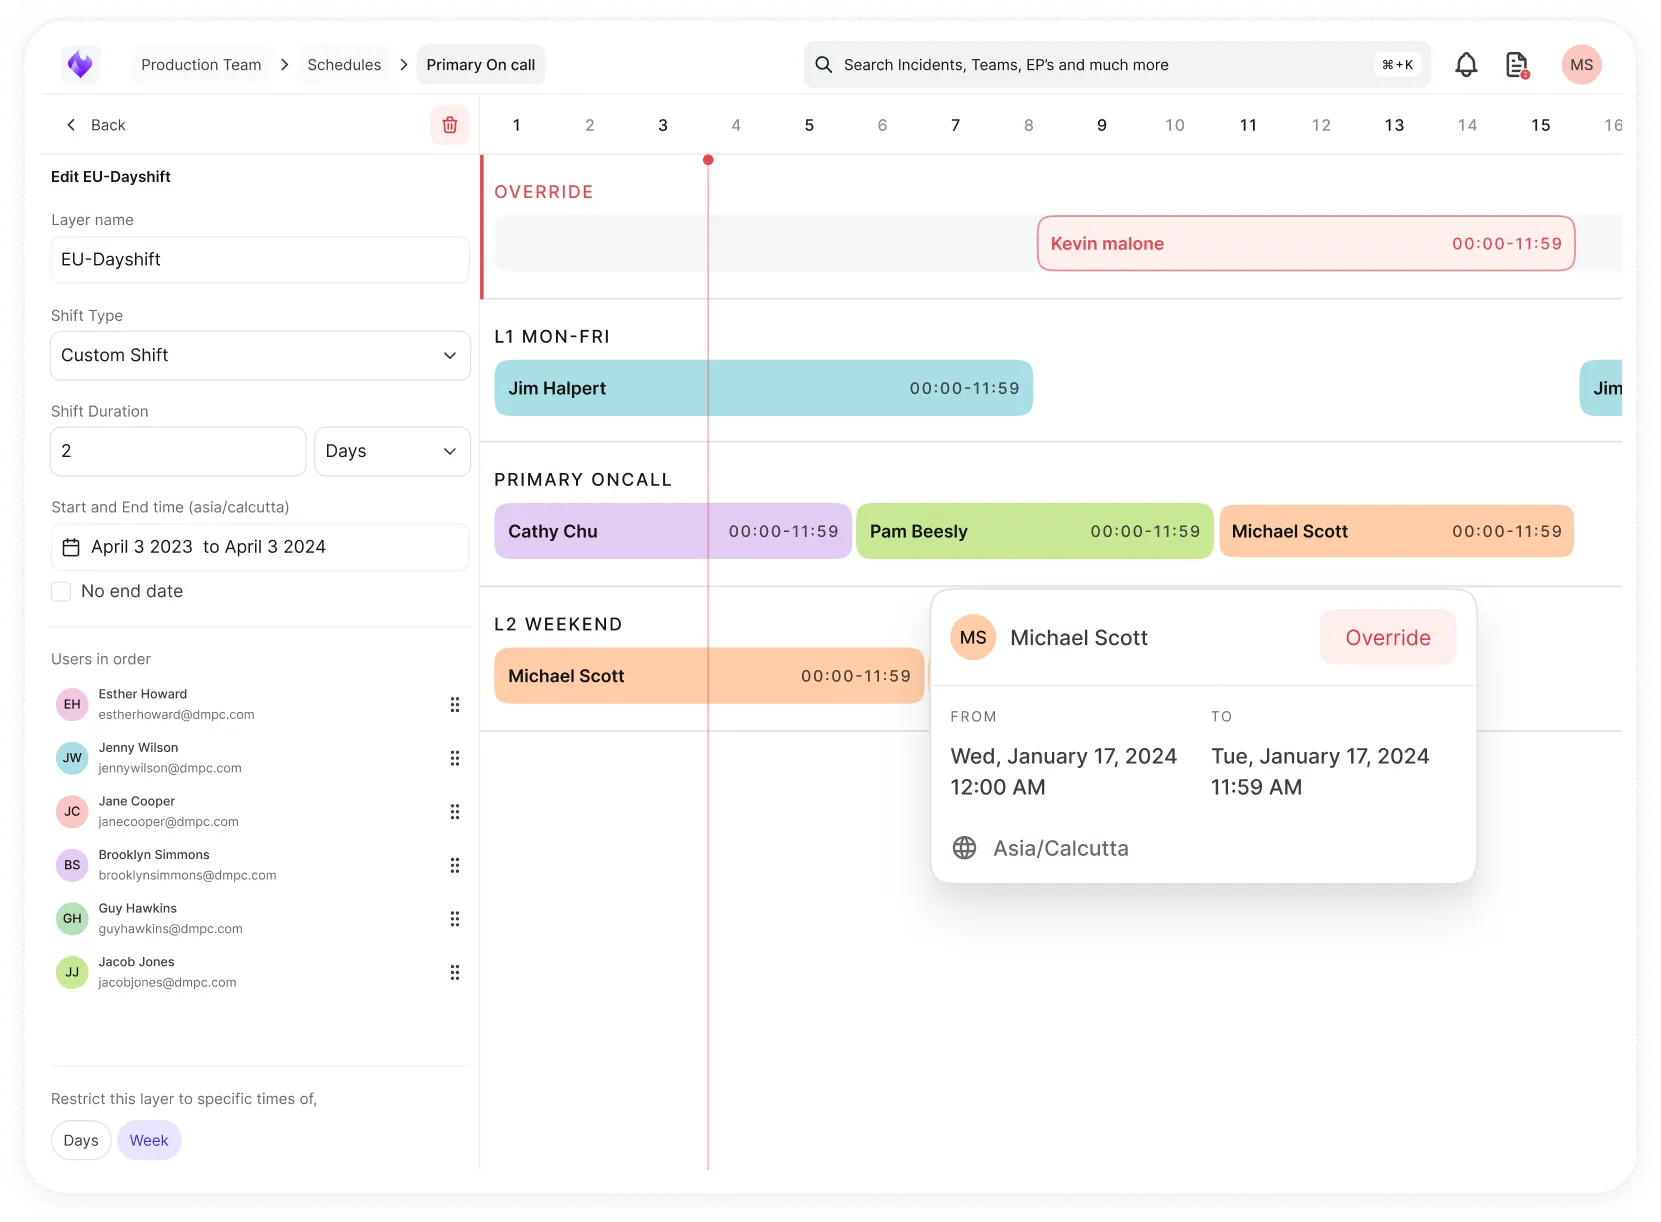
Automate postmortems, AI summaries, and post-incident workflows
Create, organize, and continuously improve your knowledge base to find the right answers with Sera AI.
We're here to help

Discover assets and keep your CMDB accurate, from any source.

Unified IT operations and service management

AI-powered ITSM for the Modern Enterprise

AI-native Incident Management for the Modern Enterprise

Communicate service health in real time

Integrate Xurrent with your full stack

The integration with Atlassian Jira using the Xurrent Integration Service is

The integration with Atlassian Jira using the Xurrent Integration Service is

The integration with Atlassian Jira using the Xurrent Integration Service is

The integration with Atlassian Jira using the Xurrent Integration Service is

The integration with Atlassian Jira using the Xurrent Integration Service is

The integration with Atlassian Jira using the Xurrent Integration Service is

The integration with Atlassian Jira using the Xurrent Integration Service is

The integration with Atlassian Jira using the Xurrent Integration Service is
Resolve issues quickly with an AI-powered system that automates ticketing.
Unifiy IT, HR, Facilities, Finance, and more on a single, AI-powered service platform.
Simplify on-call scheduling, automate escalations, and reduce burnout.
Automate postmortems, AI summaries, and post-incident workflows
Create, organize, and continuously improve your knowledge base to find the right answers with Sera AI.
Resolve plant floor and IT issues before they disrupt production.
Stay audit-ready while resolving issues and reducing operational risk.

Detect, respond, and resolve incidents fast to cut downtime and MTTR.

Keep your store online, even during your biggest sales moments.

Protect patient data and resolve issues fast, so care teams stay focused on care.

Standardize service delivery across every store and channel.

We are here to help 24/7

Connect with other Xurrent Users

Get insights and tips on how to get the most out of Xurrent

Apps, APIs, and updates

Xurrent service functionality

Eliminate manual tasks, optimize workflows, and deliver faster resolutions.
Learn how organizations have reduced downtime, improved 50% MTTA & MTTR, and cut costs with Xurrent IMR.
Discover Xurrent IMR's quick support, bidirectional integrations with Jira and Slack, and more cohesive incident response capabilities compared to Opsgenie.
Understand why users value Xurrent IMR for its intuitive interface, efficient incident alerting, customizable On-call schedules, and escalations.

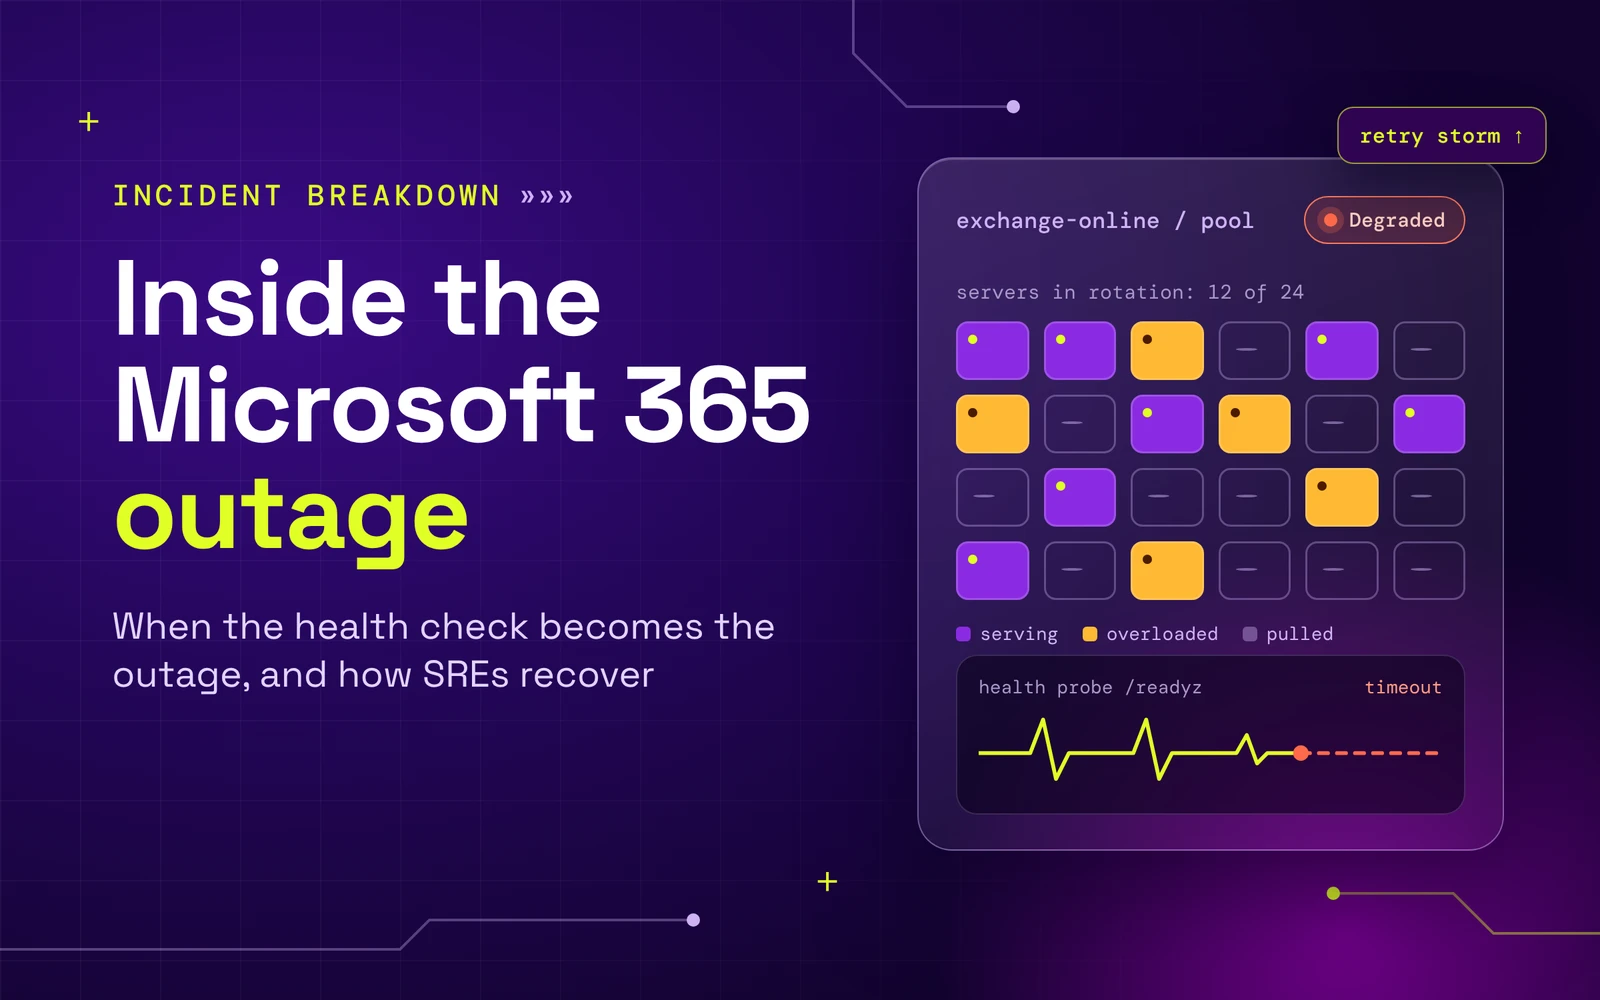
Exchange Online servers started failing health checks, the rest buckled under the load, and restored capacity kept collapsing for hours. A reconstruction from Microsoft’s own updates, with the mechanics and the config that prevents it.
Incidents EX1550543 (Exchange Online) and MO1550821 (dependent services). If your admin center won’t load, Microsoft posts the same updates at status.cloud.microsoft.
What happened, in five points
EX1550543, then MO1550821 two hours later for 18 services that read from Exchange.This post is for engineers who run services other people depend on. It reconstructs the outage from Microsoft’s own status updates, works through the failure mode those updates describe, and looks at the incident response itself: what Microsoft did at each stage, why it worked or didn’t, and what you can configure in your own stack this week. We’ll stick to what Microsoft has said publicly and mark clearly where we’re reasoning beyond it. When Microsoft publishes its post-incident review, we’ll cover the confirmed root cause in a follow-up.
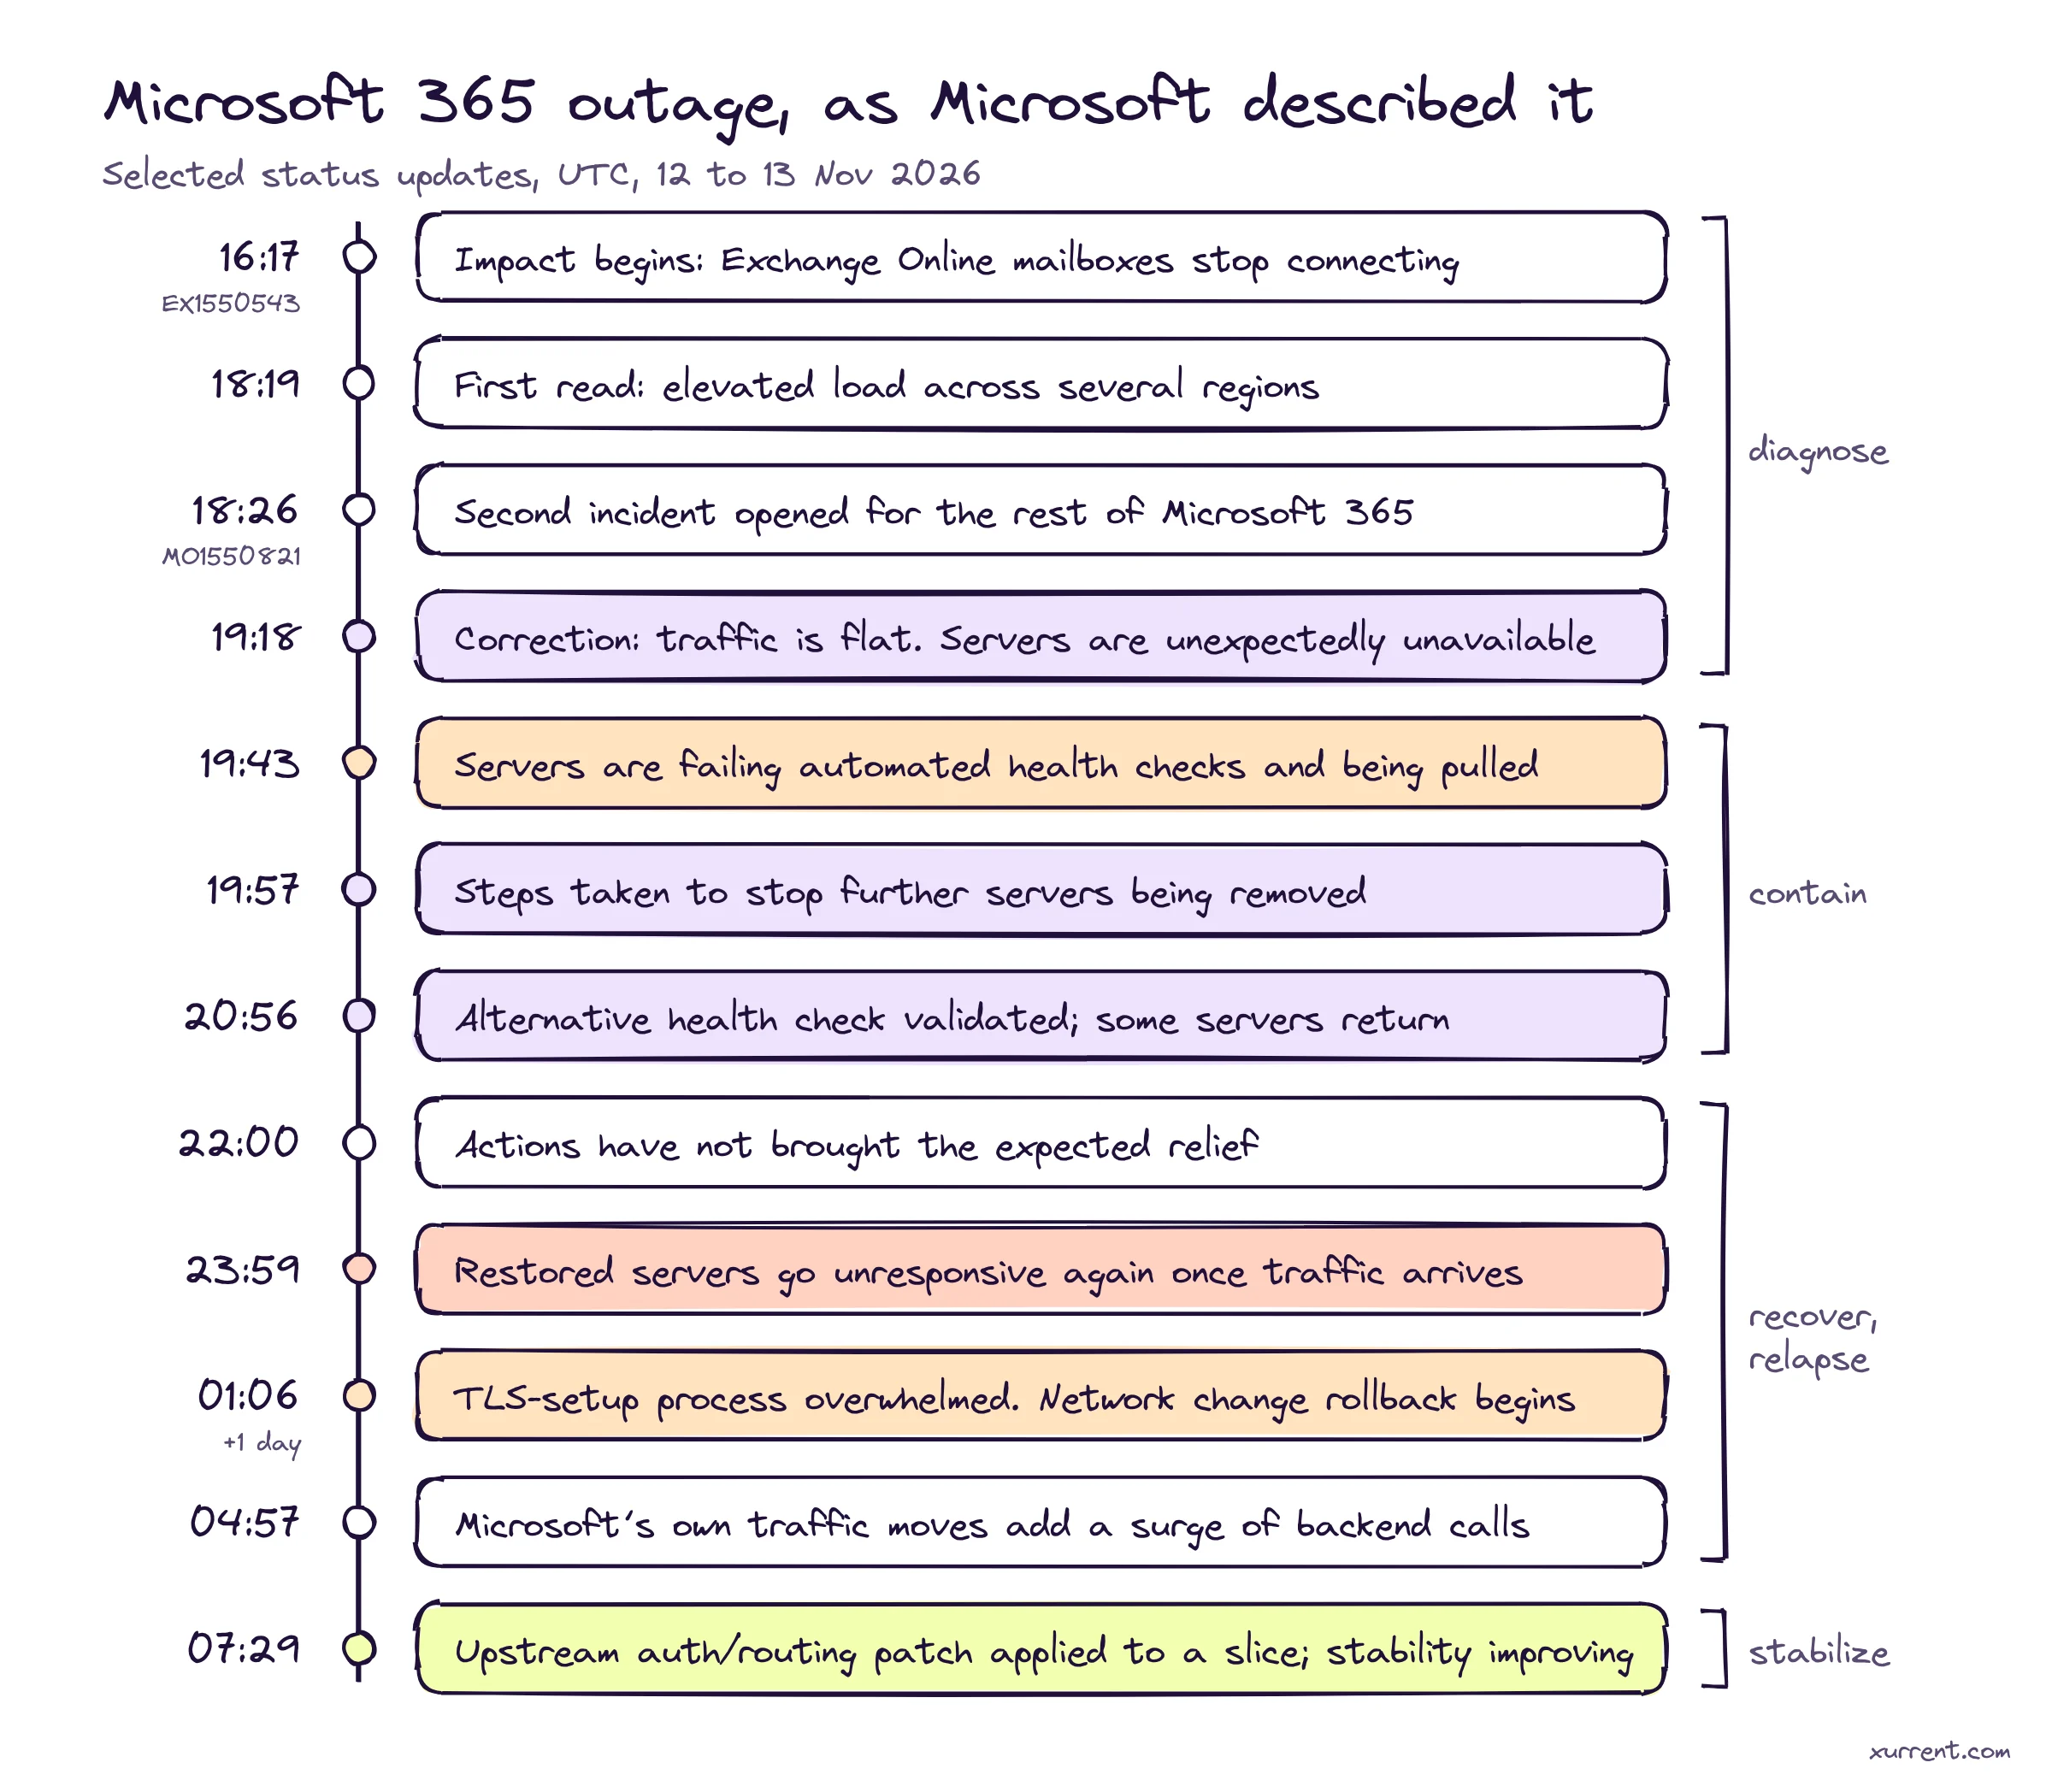
Microsoft posted 23 updates to EX1550543 in the first twelve hours, roughly one every 31 minutes, each with a “next update by” time. That cadence is the best public record of an incident this size you’ll get before a post-incident report, and the order in which Microsoft’s understanding changed is as instructive as any single update.
| Time | What Microsoft said | What it tells you |
|---|---|---|
| 12 Nov 16:17 | Users can’t connect to Exchange Online mailboxes through multiple connection methods, starting in the Americas. | OWA, MAPI, ActiveSync and REST all failing together points below the protocol layer. |
| 18:19 | Infrastructure is under elevated load across multiple regions. | First hypothesis: demand. |
| 18:26 | MO1550821 opened for dependent services. | The blast radius is now a product-wide problem. |
| ~19:06 | All deployments and configuration changes paused. | Change freeze, about three hours in. |
| 19:18 | Load isn’t from more traffic. A large number of servers are unexpectedly unavailable. | Hypothesis corrected: it’s lost capacity, not added demand. |
| 19:43 | Servers are failing automated health checks and being taken out of service, possibly linked to a recent change in the component that processes them. | The health check is now part of the failure. |
| 19:57 | Steps taken to prevent additional servers being removed. | The brake on the removal loop. |
| 20:56 | An alternative health-check method, validated on part of the fleet, returns some servers. An automated way to detect and restart unresponsive servers is being prepared. | Change what “healthy” means, then automate recovery. |
| 22:00 | Actions so far haven’t provided the anticipated relief. A core process on affected servers is overwhelmed. | The probe wasn’t the whole story. |
| 23:59 | Returned servers can become unresponsive again once they receive traffic. Some traffic types are being limited. | The recovery trap. Load shedding by traffic class begins. |
| 13 Nov 01:06 | A process responsible for establishing secure connections is being overwhelmed. Rollback of a recent network configuration change that correlates with onset has begun. | Symptom located at TLS setup; a suspect change is being reverted in parallel. |
| 03:07 | The latest change isn’t working as expected. Other ways to add capacity being explored. | Another mitigation that didn’t hold. |
| 03:34 | No indication of malicious activity. | Security question answered explicitly. |
| 04:10 | Traffic protocols adjusted, traffic redistributed, strategic traffic blocking applied. Recovery partial. | Shedding widened. |
| 04:57 | Routing services are sending a surge of calls to backend servers, partly because of traffic moves made during the event. VMs being scaled up; some machines stuck in a bad state blocked a network change from syncing. | A mitigation created new load. |
| 07:29 | Positive stability results after patching an upstream authentication and routing configuration component on part of the infrastructure; expanding. | Fix found, rolled out by slice. |
Three things stand out. First, Microsoft corrected its own diagnosis in public within an hour, from “elevated load” to “servers unavailable”. Second, the first containment step that worked (stopping removals) arrived about 25 minutes after the health-check finding, which is fast for a fleet that size. Third, the hardest stretch of the incident came after containment, when capacity that had been restored kept failing under real traffic. That last pattern is the one most worth understanding, because it can happen to a service of any size.
Exchange Online holds mailboxes, calendars and contacts, and a large share of Microsoft 365 reads from it. Teams asks Exchange for your calendar when you schedule a meeting. Copilot asks it for mail when you query your inbox. Microsoft Graph proxies mail and calendar requests to it for thousands of third-party apps. Defender for Office 365 inspects mail and links that flow through it. When Exchange stopped answering, every feature on one of those paths failed with it, and Microsoft listed them one by one under MO1550821.
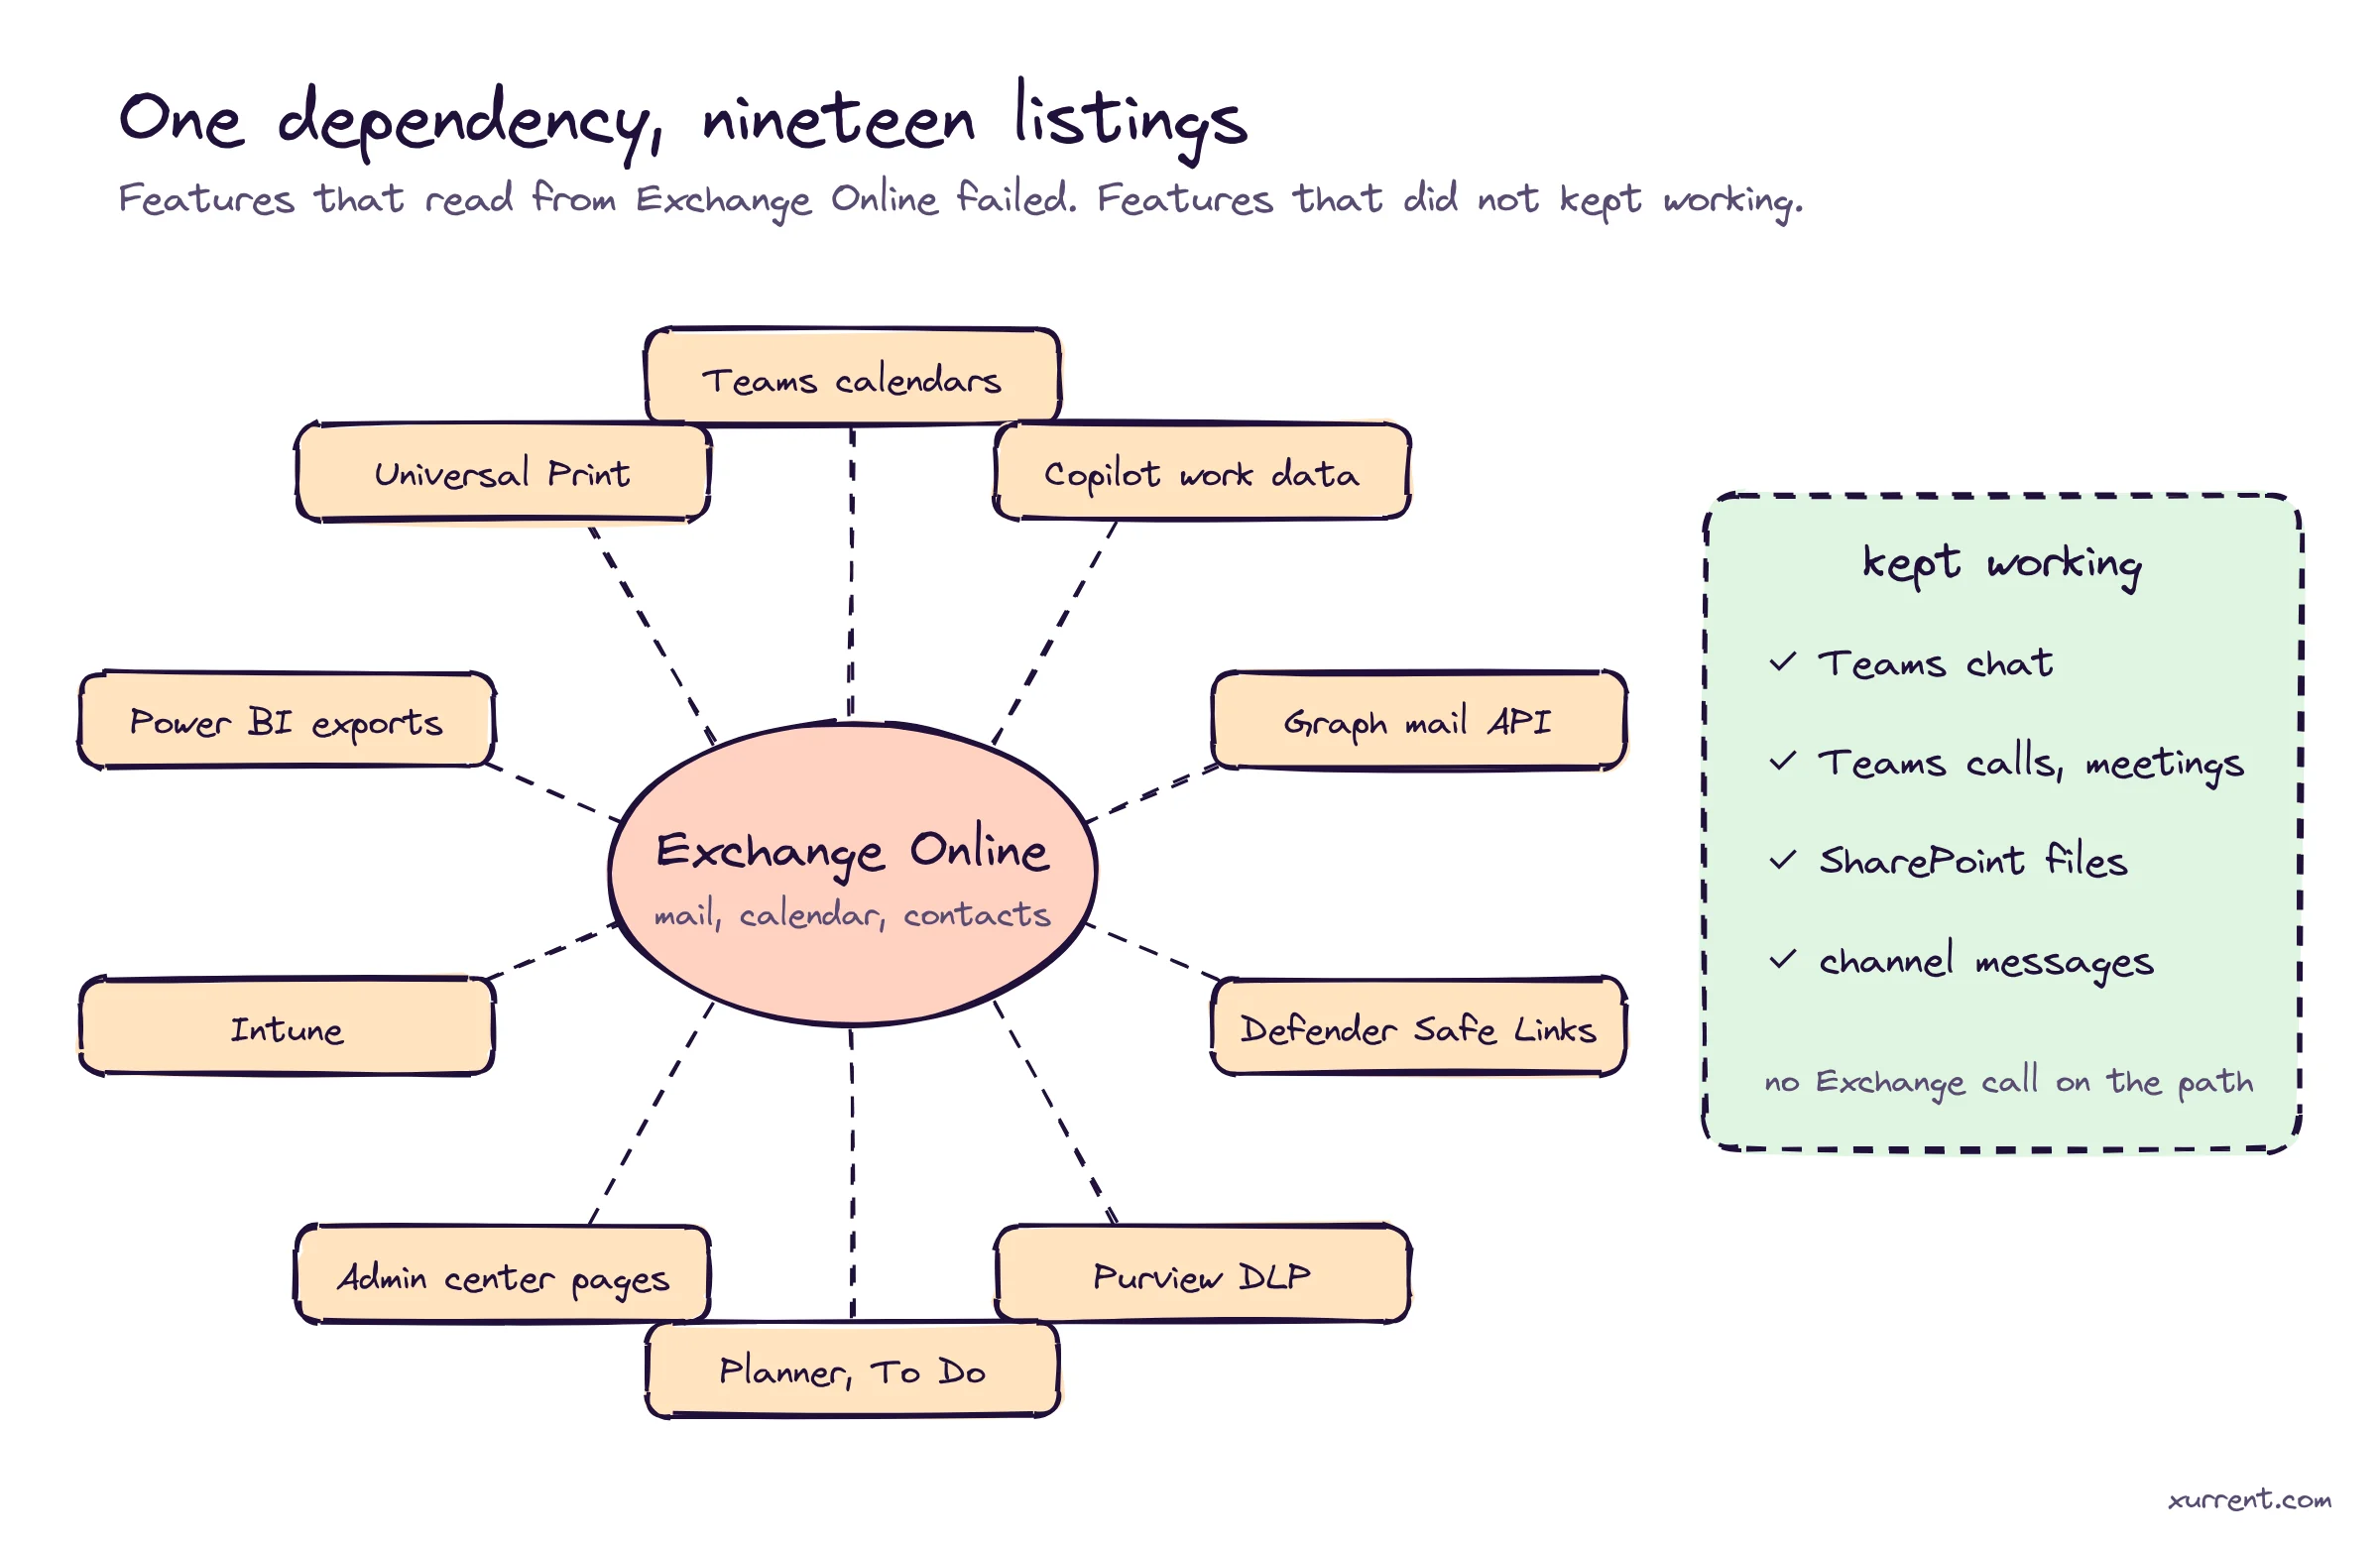
The useful part is the negative space. Microsoft said Teams calls, meetings, group chats and channel messages were largely unaffected, and files stored directly in SharePoint stayed reachable. None of those need Exchange on the request path. Teams as a product was partly up and partly down, split precisely along a dependency boundary.
That’s a design pattern you can apply deliberately. For every feature in your product, write down which dependencies sit on its request path and what it should do when each one times out: render from cache, hide the panel, queue the write, or fail the whole request. Most teams discover their real dependency graph during an outage. Writing it down beforehand is cheaper.
A load balancer health check is a small, frequent request (open a connection, maybe fetch /healthz) with a timeout and a failure threshold. Fail it a few times in a row and the server leaves rotation. That’s exactly right when one server has a bad disk. It goes wrong when servers fail the check because they’re busy, or when the check itself is broken.
Microsoft’s 19:43 update covers both cases: servers were failing automated checks, and the failures may have traced back to a recent change in the component that processes those checks. Either way, the mechanics that follow are the same.
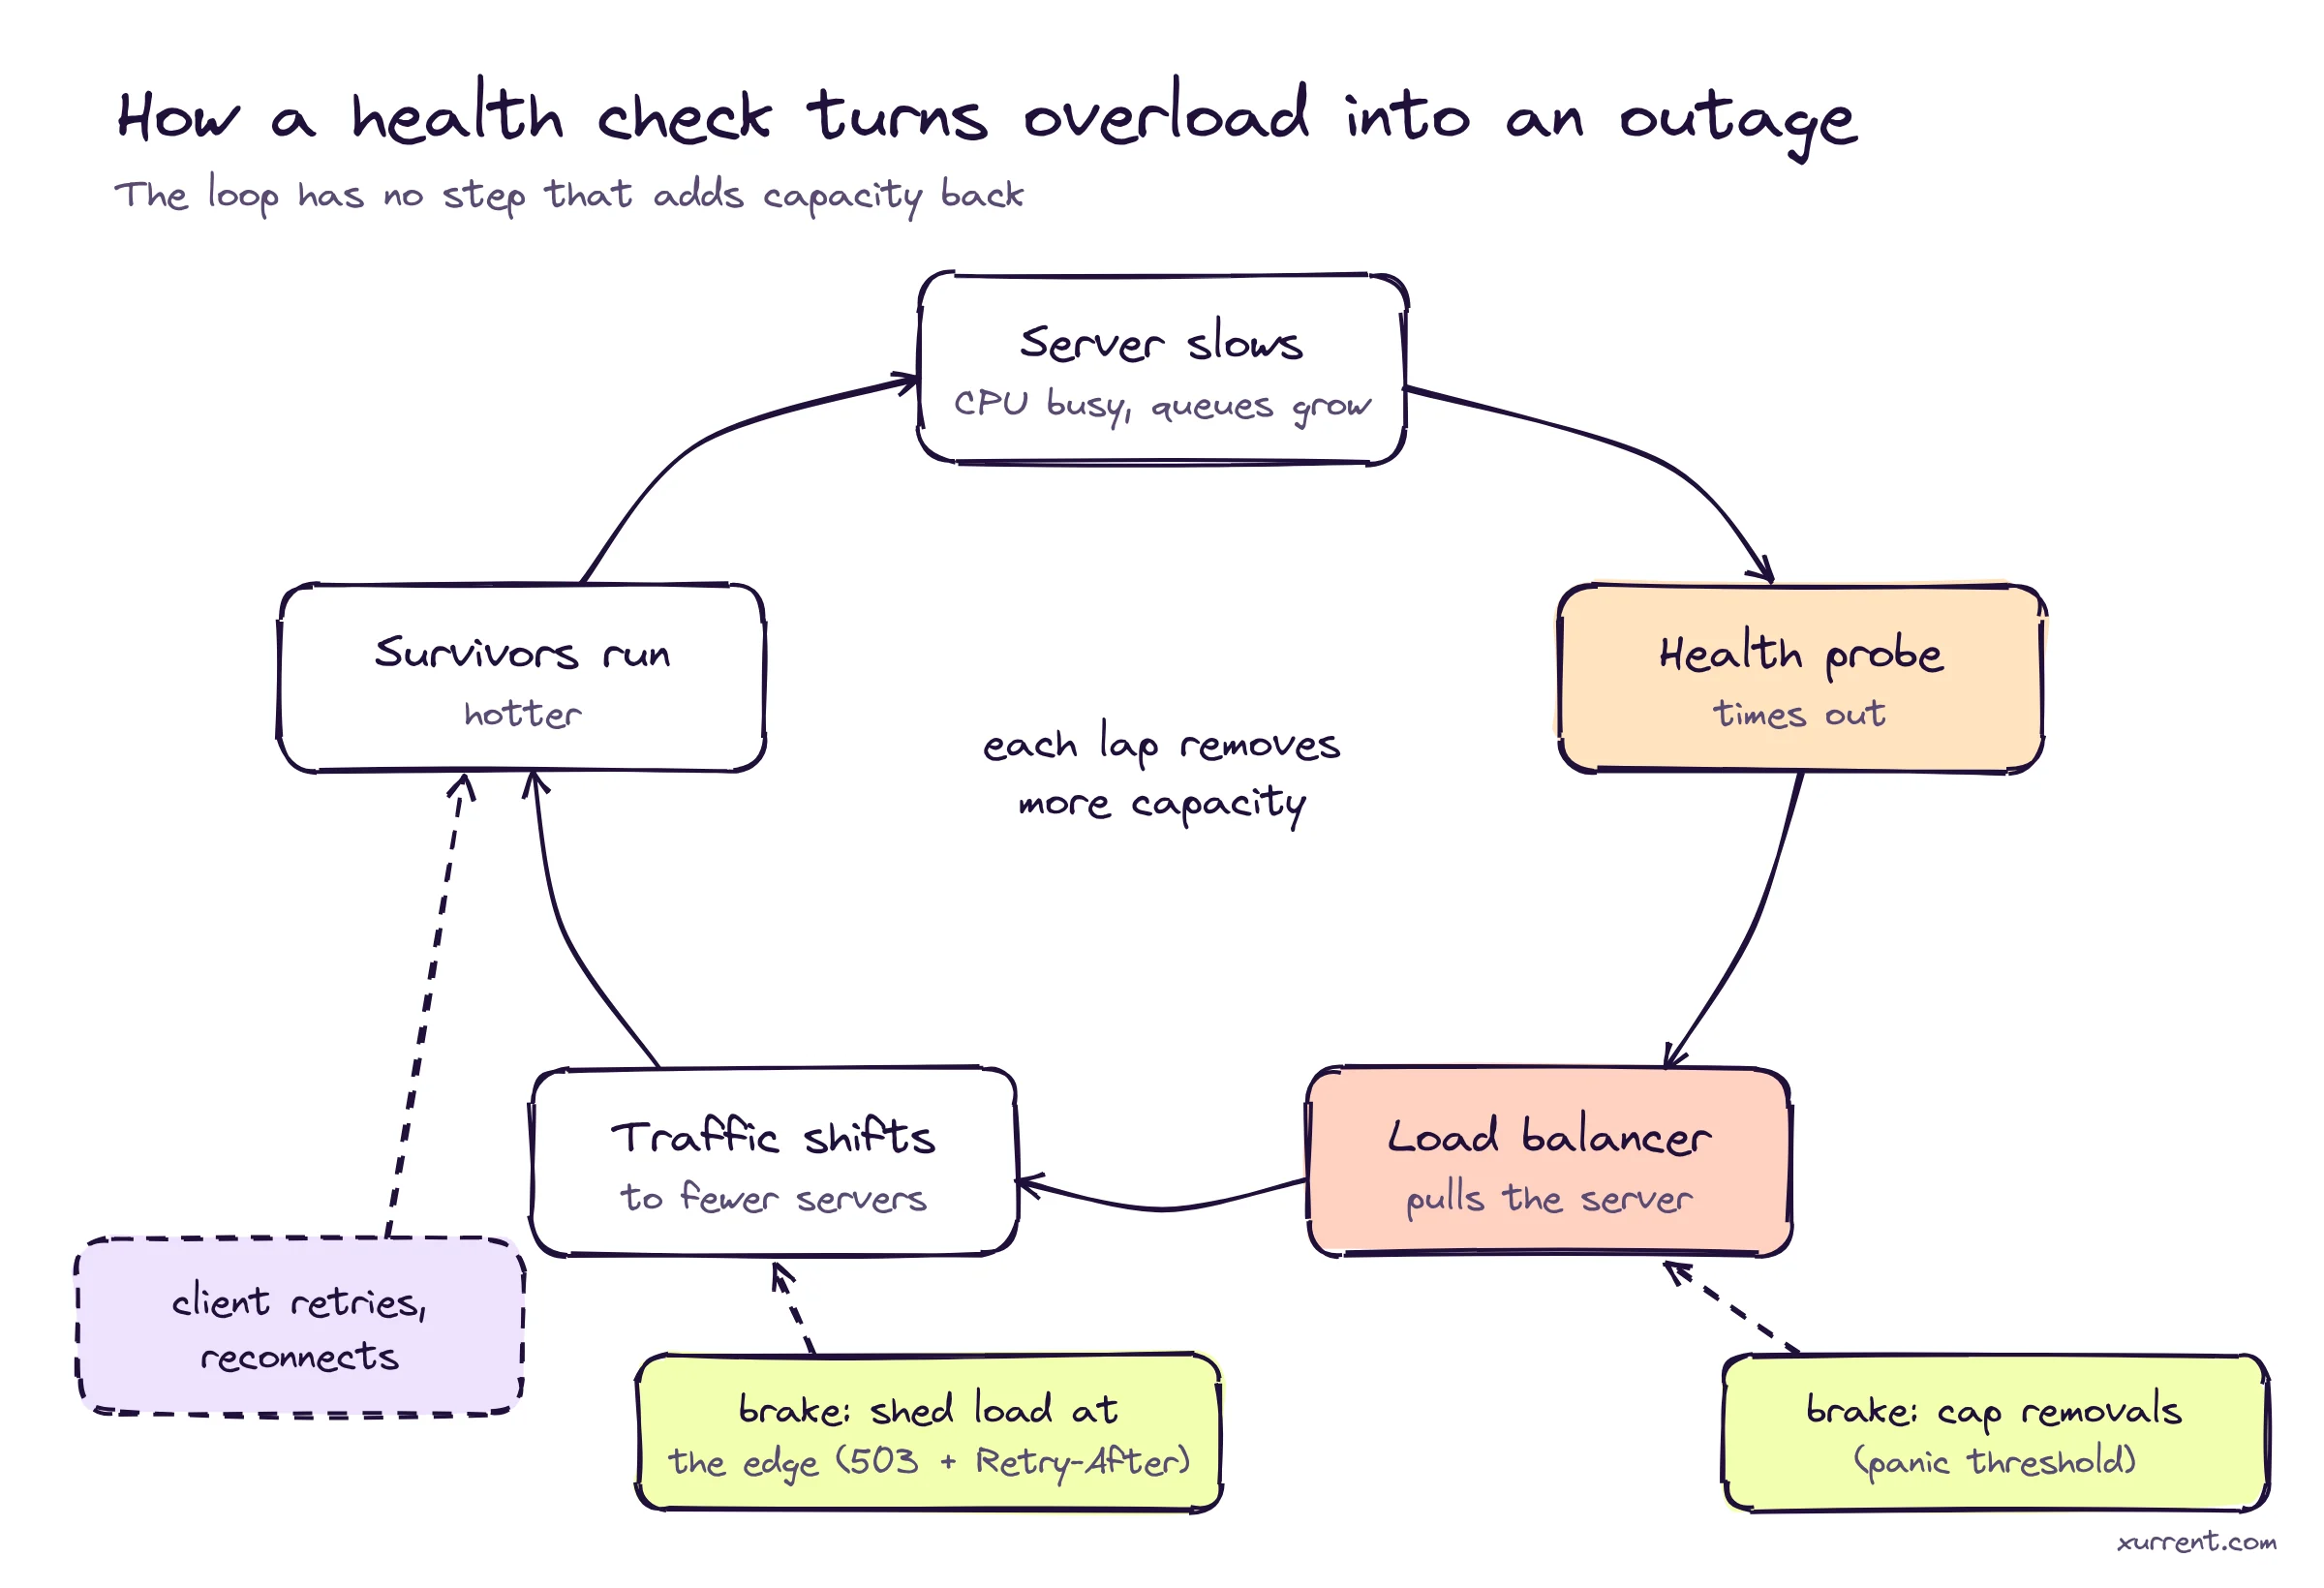
Utilization doesn’t rise linearly as you remove servers, and latency rises much faster than utilization. A rough model makes the shape visible. Take a pool of 100 servers at 60% CPU, a 100 ms service time, and a health probe with a 2-second timeout. Remove k servers and the survivors’ utilization becomes 0.6 × 100 / (100 − k). In a simple queueing model, mean response time scales with 1 / (1 − ρ), and the 99th percentile sits about 4.6 times above the mean.
ρ(k) = ρ₀ × N / (N − k) mean = S / (1 − ρ) p99 ≈ 4.6 × mean
| Servers removed (k) | Utilization ρ | Mean latency | p99 latency | 2 s probe |
|---|---|---|---|---|
| 0 | 0.60 | 250 ms | 1.15 s | passes |
| 10 | 0.67 | 300 ms | 1.38 s | passes |
| 20 | 0.75 | 400 ms | 1.84 s | passes, barely |
| 25 | 0.80 | 500 ms | 2.30 s | tail probes fail |
| 30 | 0.86 | 700 ms | 3.22 s | most probes fail |
Illustrative M/M/1 approximation with N = 100, ρ₀ = 0.6, S = 100 ms. Real servers aren’t M/M/1 and Microsoft’s numbers are unknown; the point is the shape of the curve, not the values.
Two things follow. Probes sample the tail, not the mean, so they start failing well before average latency looks alarming. And each server the probes remove pushes the survivors further up a curve that steepens as it climbs. Losing the first 20 servers costs you little headroom. Losing the next 5 tips the pool into the zone where probes fail on healthy-but-busy machines, which removes more of them. Add client retries, which raise demand exactly when capacity falls, and the pool can empty itself in minutes.
Google’s SRE book identifies overload as the most common cause of cascading failures, and lists health checks that fail under load as one of the ways a slowdown turns into a full outage. Microsoft’s 19:57 action, preventing additional servers from being removed, is the textbook brake.
Part of the fix is semantic. A check that answers “is this process alive?” should only ever restart a process that’s actually wedged. A check that answers “should this instance get traffic right now?” should only ever route traffic away, never restart. Conflating the two turns a load spike into a restart storm: busy pods fail liveness, get killed, come back cold, and take traffic from a queue that’s now even longer.
# Liveness restarts. Readiness only routes. Keep them separate.
livenessProbe:
  # event loop alive? no dependency calls
  httpGet: { path: /livez, port: 8080 }
  periodSeconds: 10
  timeoutSeconds: 5
  # 60 s of failures before a restart: slow is not dead
  failureThreshold: 6
readinessProbe:
  # can it take traffic now? checks local queue depth
  httpGet: { path: /readyz, port: 8080 }
  periodSeconds: 5
  timeoutSeconds: 2
  failureThreshold: 3
startupProbe:
  httpGet: { path: /livez, port: 8080 }
  failureThreshold: 30
  # up to 150 s to warm caches before liveness applies
  periodSeconds: 5
Keep /livez free of downstream calls. If liveness fails because a database is slow, every pod restarts at once and the database gets a reconnect storm on top of its original problem.
The second part is a hard limit. If more than a third of a pool fails its checks at the same moment, the likelier explanation is a shared cause (the check, the network, a dependency) rather than a third of your servers independently going bad. Load balancers can encode that assumption. Envoy’s panic threshold routes to every host, healthy or not, once the healthy share drops below a set percentage. Outlier detection has a separate cap on how many hosts it may eject.
clusters:
- name: mail_frontend
  lb_policy: ROUND_ROBIN
  common_lb_config:
    # below 50% healthy, ignore health and use all hosts
    healthy_panic_threshold: { value: 50.0 }
  health_checks:
  - timeout: 2s
    interval: 5s
    unhealthy_threshold: 3
    healthy_threshold: 2
    http_health_check: { path: /readyz }
  outlier_detection:
    consecutive_5xx: 5
    interval: 10s
    base_ejection_time: 30s
    # never eject more than 30% of hosts
    max_ejection_percent: 30
  round_robin_lb_config:
    slow_start_config:
      # ramp traffic to a returning host over 2 min
      slow_start_window: 120s
      aggression: { default_value: 1.0, runtime_key: mail_frontend.ss_aggression }
Panic routing sends some requests to genuinely broken hosts. That’s the trade: a fraction of errors instead of an empty pool. AWS target groups offer a similar control through minimum healthy target settings.
The update at 23:59 UTC is the one experienced on-call engineers will have winced at. Microsoft said servers returned to service could become unresponsive again once they received traffic. At 01:06 it narrowed the symptom: a process on the affected servers responsible for establishing secure connections was being overwhelmed.
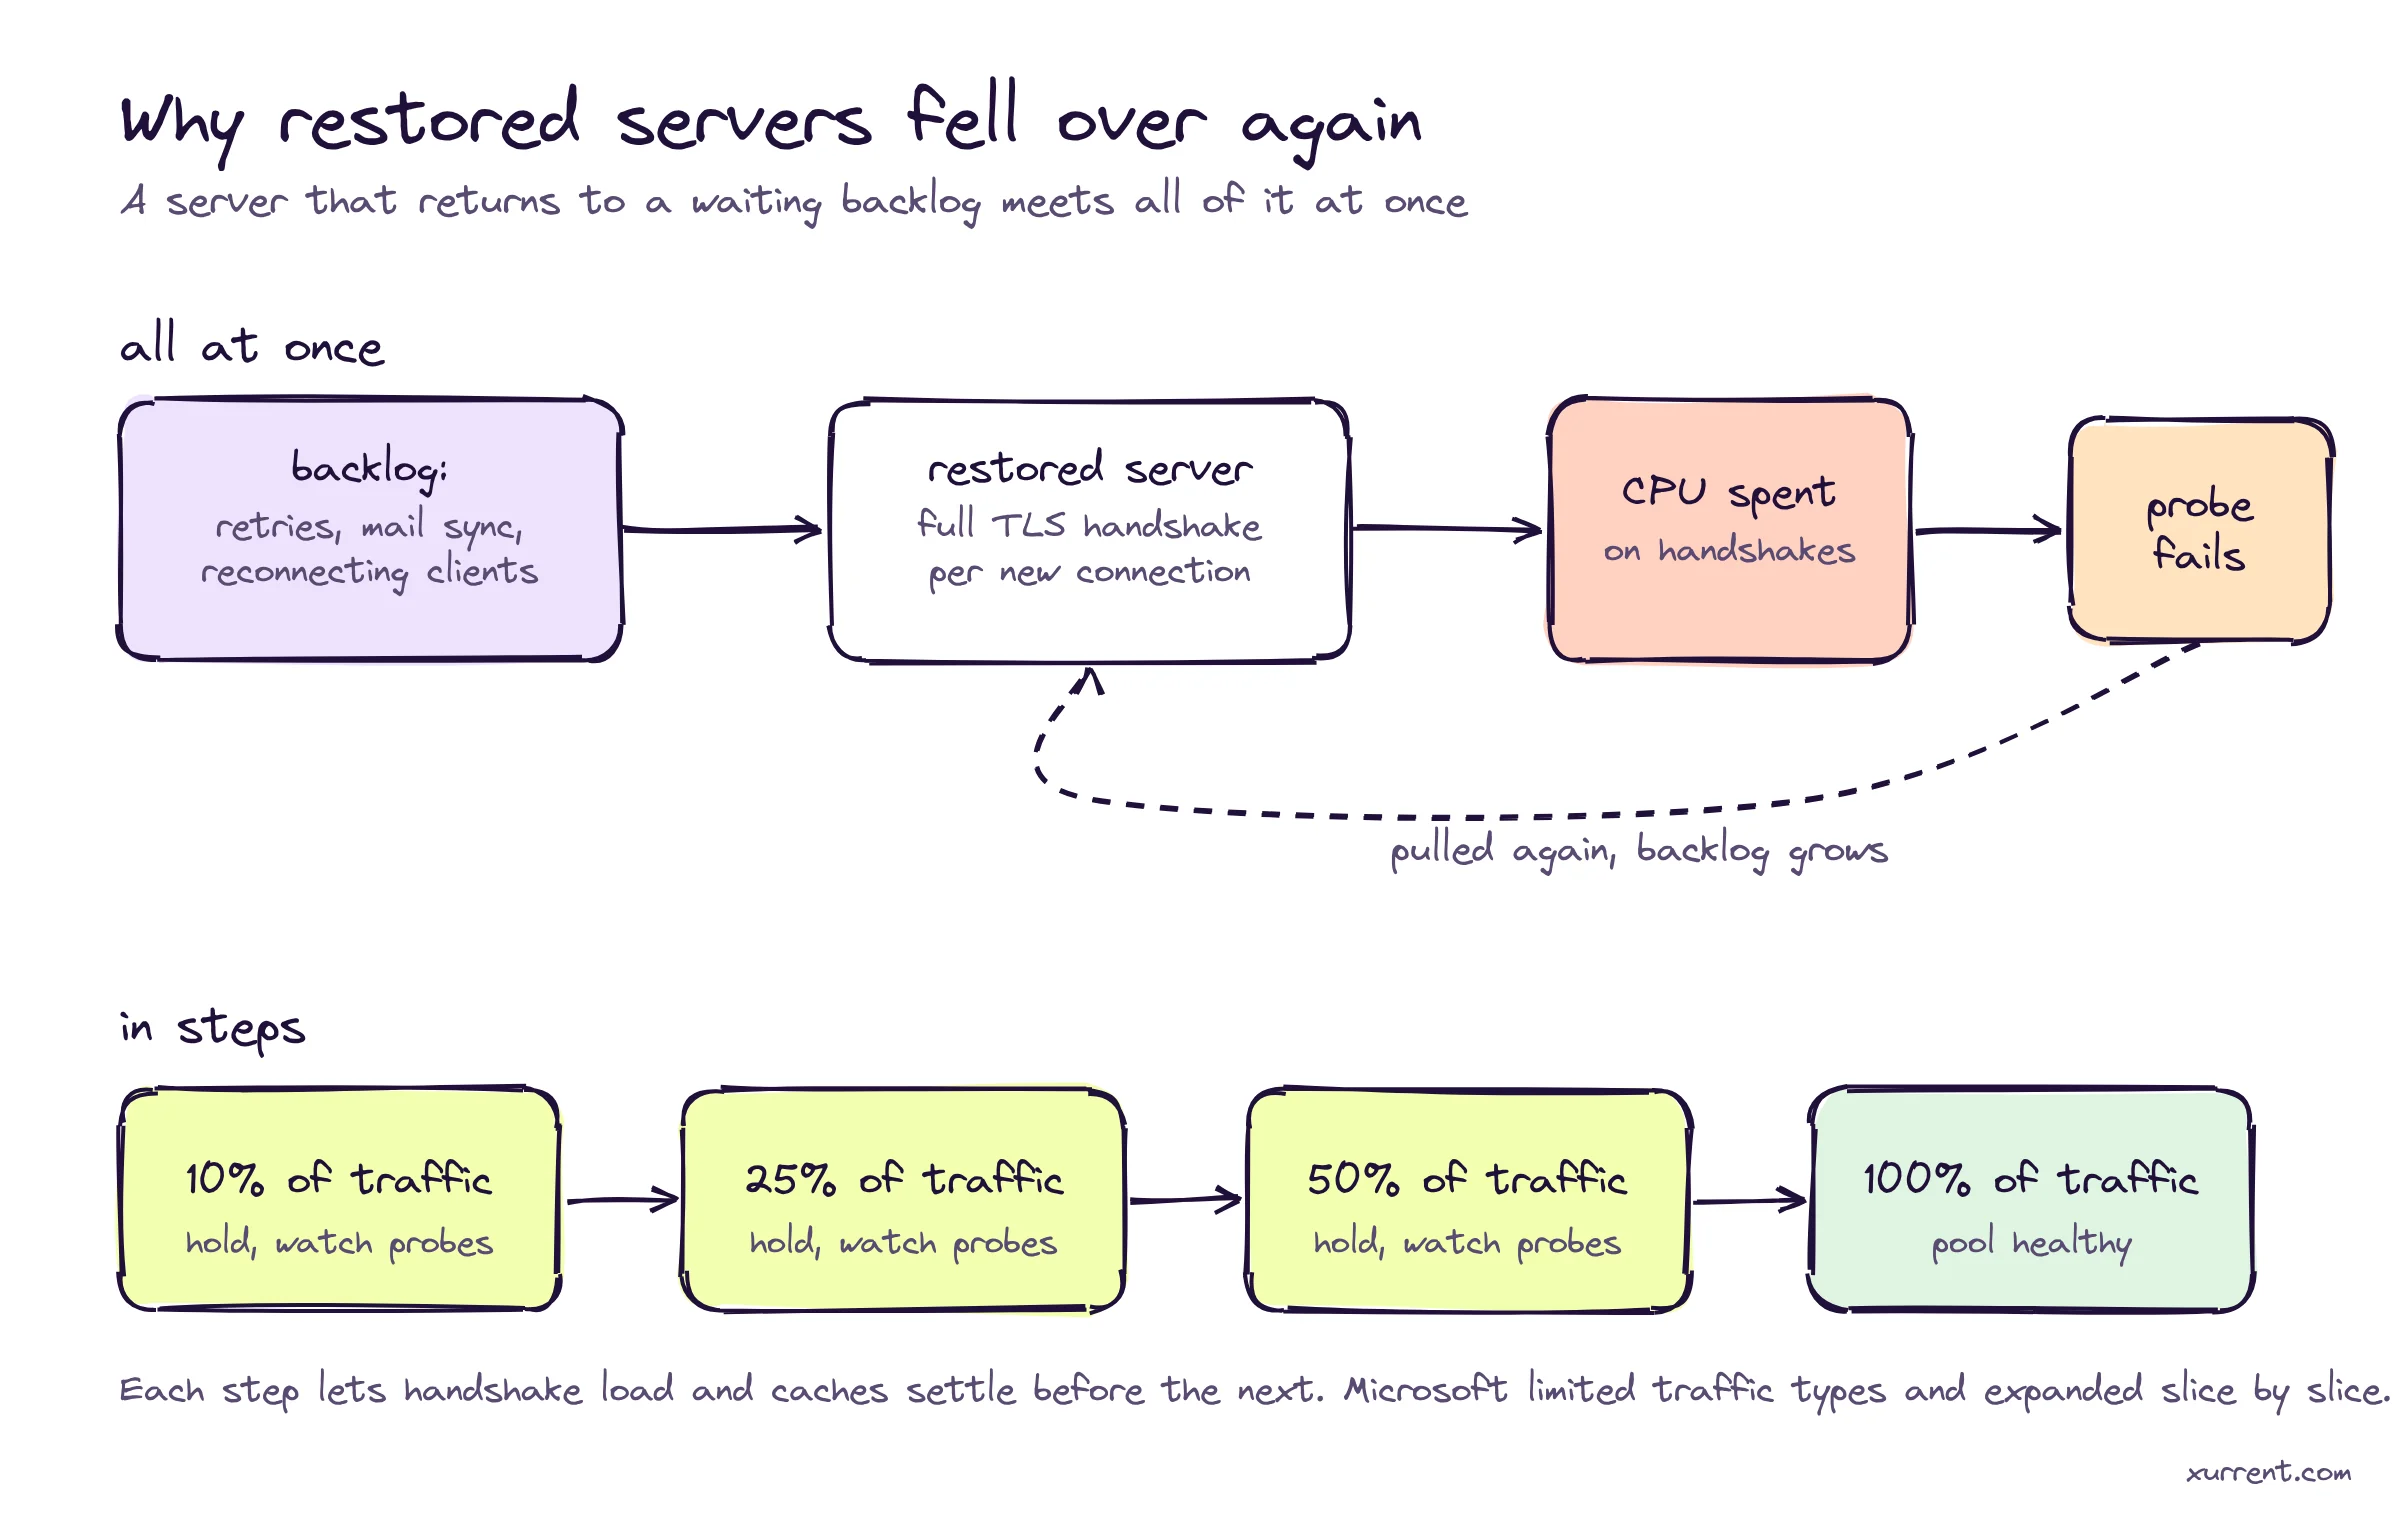
Microsoft hasn’t explained why the connection-setup process overloaded, and its later updates point at an upstream authentication and routing component, so treat what follows as general mechanics rather than a diagnosis. Still, the pattern is well known.
When a service has been failing for hours, demand doesn’t wait politely. Outlook desktop clients retry their connections. Mobile devices on ActiveSync reconnect on a timer. Sync tools and Graph integrations retry with their own policies, some of them aggressive. All of that accumulates. A server that comes back is the first available capacity the backlog has seen in hours, and it gets hit by connection attempts from far more clients than it served before the incident.
Each of those connections starts with a TLS handshake. A full handshake involves a key exchange and a signature with the server’s private key, which is expensive in CPU terms. A resumed session, using a ticket or cached session from an earlier connection, skips most of that work. After a restart, a server may have lost its local session cache, and clients whose tickets it can’t decrypt fall back to full handshakes. So a restored server faces its worst-case CPU cost per connection, at its highest connection rate, at a moment when caches above and below it are cold too.
If the handshake work alone saturates the CPU, the server can’t answer health probes either, and the load balancer pulls it again. Nothing about the original trigger needs to still be present for this to repeat. The overload is now self-sustaining, which is the behavior distributed-systems researchers call a metastable failure.
You can see the gap between full and resumed handshakes on your own endpoints with stock OpenSSL. Run it against a staging host, not production.
# Full handshakes: a new session every connection
openssl s_time -connect staging.example.com:443 -new -time 10

# Resumed sessions: reuse the first session for every connection
openssl s_time -connect staging.example.com:443 -reuse -time 10

# Compare "connections per user sec". The ratio is your headroom cost
# when a restart or key rotation forces every client back to full handshakes.
Watch server CPU during the -new run, not just the client-side rate. That’s the load a restored host faces when thousands of clients reconnect at once.
If every host in a pool shares the same session-ticket keys, a client can resume against any of them, including one that just restarted. Distribute the keys from a secret store, rotate them on a schedule, and keep the previous key loaded for decryption so rotation doesn’t force a fleet-wide wave of full handshakes.
ssl_protocols        TLSv1.2 TLSv1.3;
# per-host cache, lost on restart
ssl_session_cache    shared:SSL:50m;
ssl_session_timeout  4h;
ssl_session_tickets  on;

# Same key files on every host. First key encrypts new tickets;
# the second still decrypts tickets issued before the last rotation.
ssl_session_ticket_key /etc/nginx/tls/ticket_current.key;
ssl_session_ticket_key /etc/nginx/tls/ticket_previous.key;
Ticket keys protect session secrecy, so treat them like private keys: short rotation, never in the repo, delivered by your secret manager.
Rejecting work is the move that actually breaks a metastable loop. A fast rejection costs almost nothing; a request that times out costs its full share of work and still fails. Where you reject matters too. If TLS setup is the expensive step, a limit that only applies after the handshake (most HTTP-layer rate limiting) protects nothing. The limit has to sit at the connection layer, before the handshake starts.
frontend fe_mail
  bind :443 ssl crt /etc/haproxy/certs/ alpn h2,http/1.1
  maxconn 20000
  # new sessions/sec accepted, enforced before TLS
  rate-limit sessions 1500

  # Per-client connection rate, evaluated at accept time, pre-handshake
  stick-table type ip size 1m expire 60s store conn_rate(10s)
  tcp-request connection track-sc0 src
  tcp-request connection reject if { sc0_conn_rate gt 60 }

  default_backend be_mail

backend be_mail
  balance leastconn
  server m1 10.0.1.11:8443 check inter 5s fall 3 rise 2 slowstart 120s
  server m2 10.0.1.12:8443 check inter 5s fall 3 rise 2 slowstart 120s
slowstart ramps a recovering server’s weight over two minutes, the per-host version of admitting traffic in steps. Microsoft did the same at fleet scale, limiting traffic types and expanding slice by slice.
Retries are the fuel. Three retries per call at each of three layers turns one user request into as many as 64 backend attempts during an outage. Exponential backoff with jitter spreads retries out but doesn’t reduce their number. A retry budget does: once retries exceed a fixed share of recent calls, the client stops retrying and fails fast.
import random, time, collections

class TransientError(Exception): pass

class RetryBudget:
    """Allow retries while they stay under `ratio`
    of calls in the last `window` seconds."""
    def __init__(self, ratio=0.1, window=10.0, min_retries=3):
        self.ratio, self.window, self.min = ratio, window, min_retries
        self.calls = collections.deque()
        self.retries = collections.deque()

    def _trim(self, q, now):
        while q and now - q[0] > self.window: q.popleft()

    def record_call(self):
        self.calls.append(time.monotonic())

    def try_retry(self):
        now = time.monotonic()
        self._trim(self.calls, now)
        self._trim(self.retries, now)
        if len(self.retries) < max(self.min, self.ratio * len(self.calls)):
            self.retries.append(now); return True
        return False

def call(fn, budget, attempts=3, base=0.2, cap=10.0):
    for n in range(attempts):
        budget.record_call()
        try:
            return fn()
        except TransientError:
            if n == attempts - 1 or not budget.try_retry():
                raise
            # full jitter
            time.sleep(random.uniform(0, min(cap, base * 2 ** n)))
If you run Envoy, circuit_breakers.thresholds.retry_budget does this at the proxy for every client behind it, which is easier than fixing every SDK.
Read as a sequence, Microsoft’s public actions follow the standard playbook for a self-sustaining overload, in roughly the right order. Each one is worth naming because each one is easy to skip under pressure.
At 04:57 Microsoft said its own routing services were sending a surge of calls to backend servers, partly because of traffic it had moved during the event. Rebalancing traffic away from a struggling region concentrates load somewhere else. It’s worth saying so publicly, as Microsoft did, and worth logging every traffic move with a timestamp so the effect of each one can be traced later.
Microsoft’s update discipline held for the whole incident: a post roughly every 30 to 60 minutes, each naming the time of the next one, including when the honest update was that the last action hadn’t worked. Silence is what fills a support queue, and a predictable cadence lets admins stop refreshing and plan around it.
The harder lesson is about where updates live. Admins normally read service health in the Microsoft 365 admin center, but Microsoft listed some admin center pages among the affected features. It pointed admins to status.cloud.microsoft instead, a channel that doesn’t depend on the failing service.
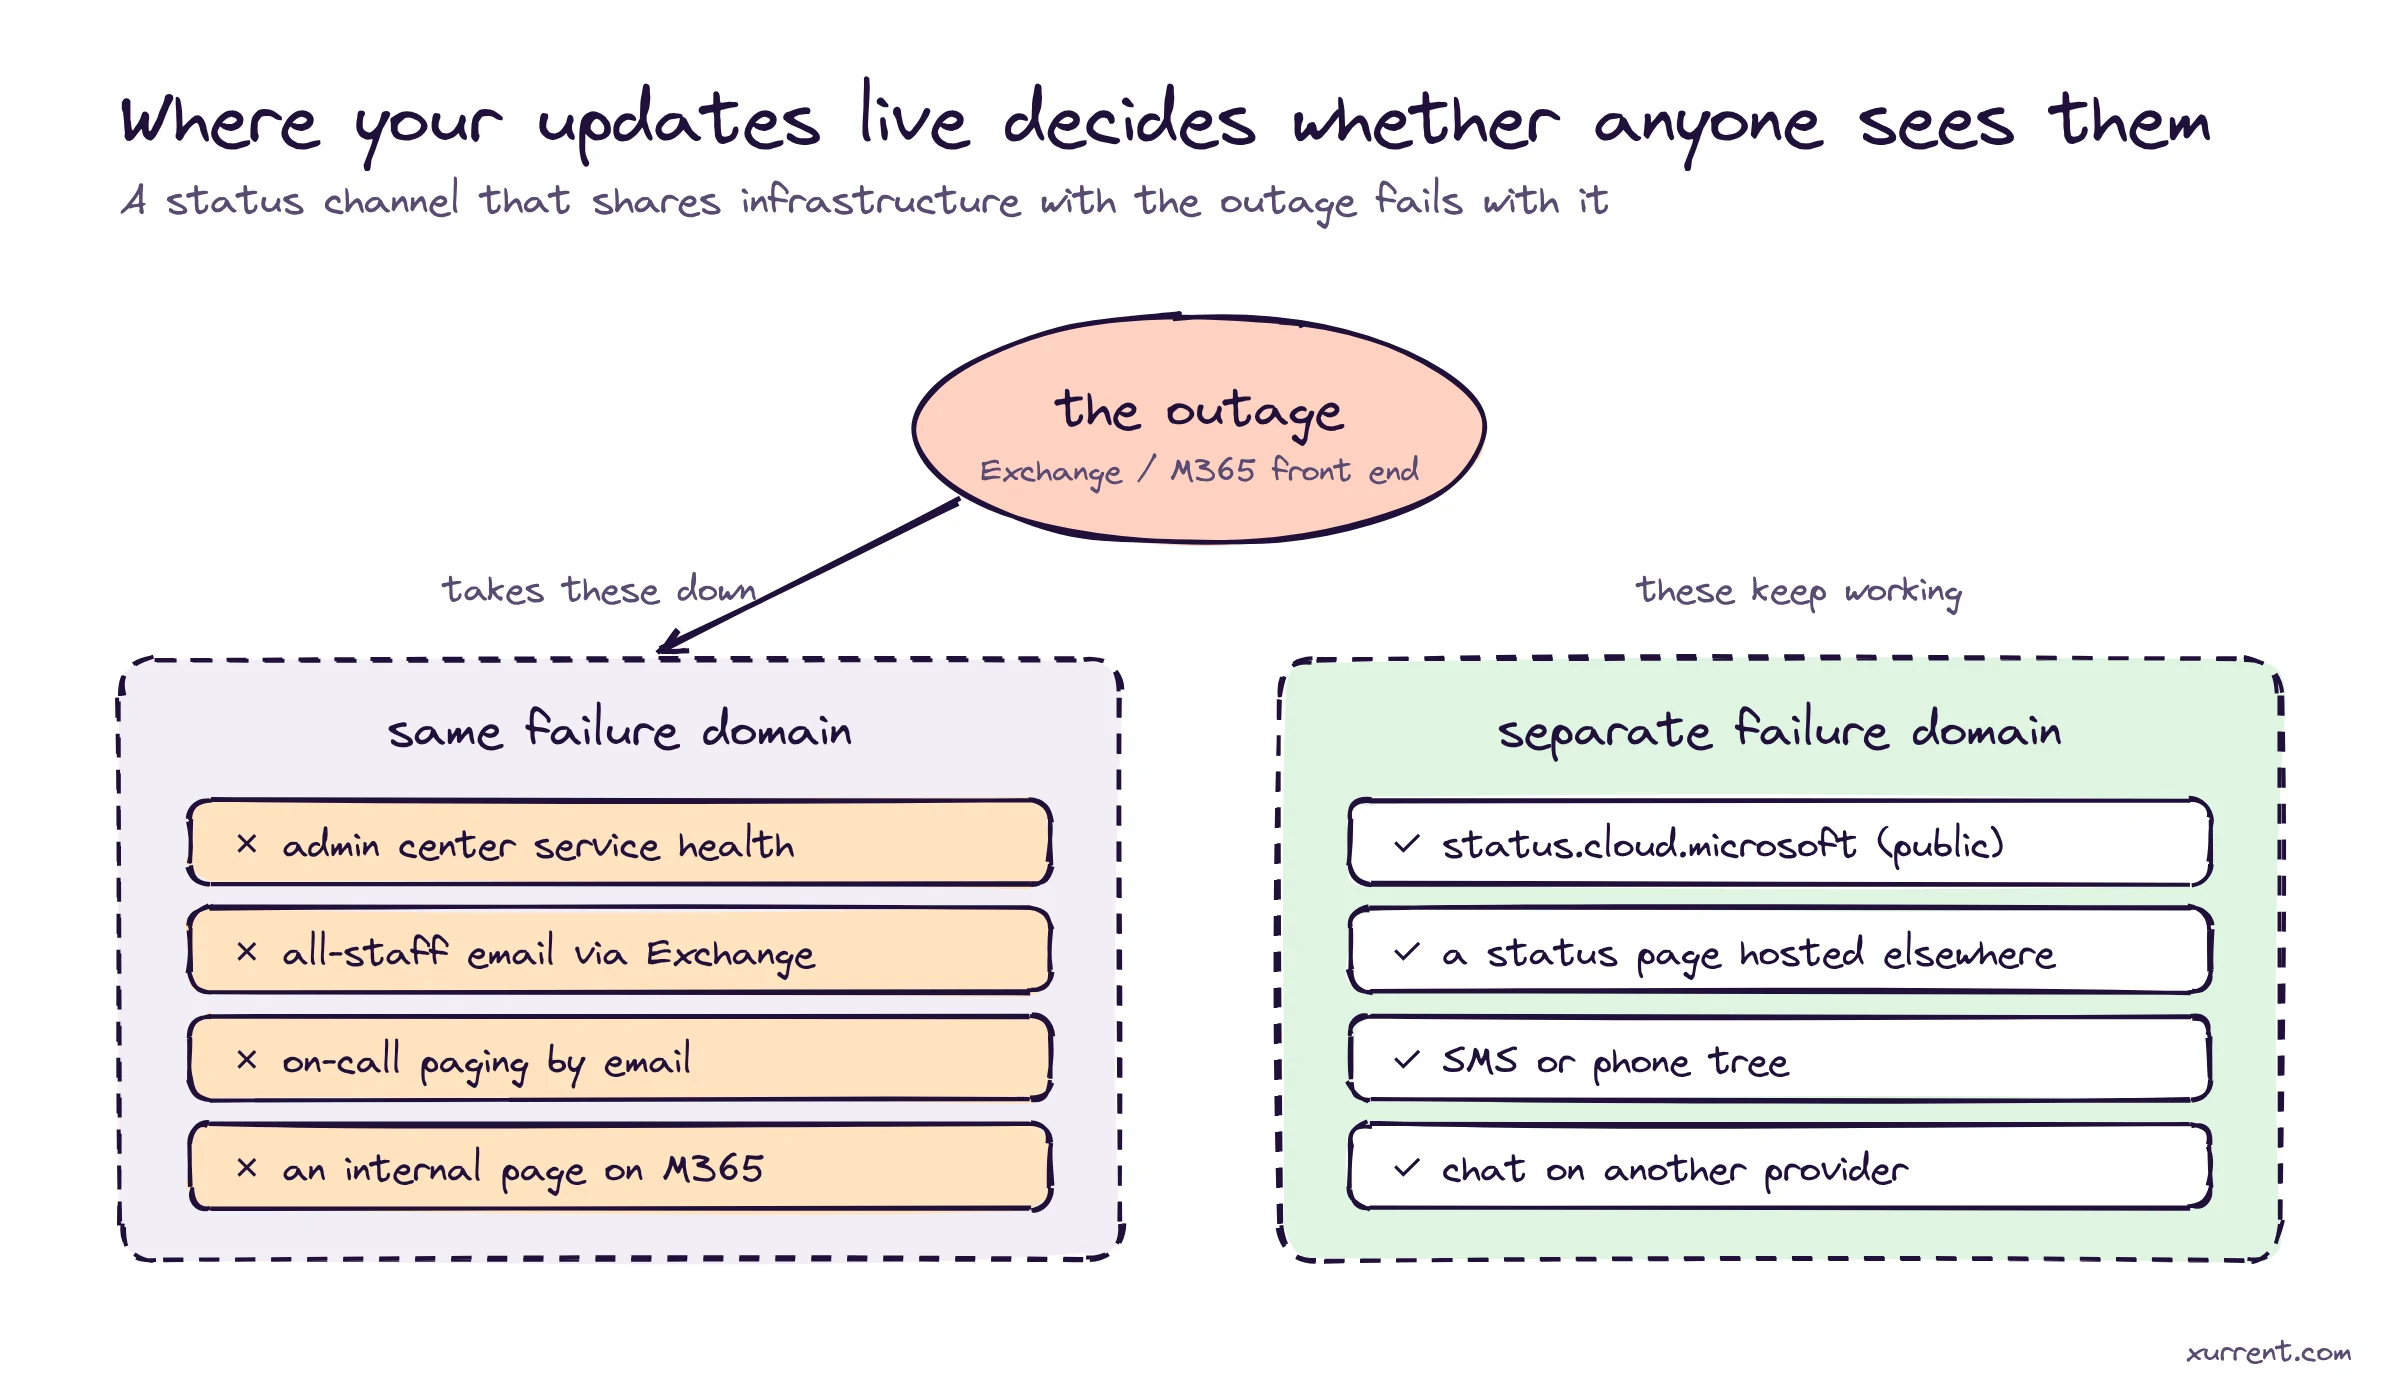
The same applies one level down. Many companies tell their own staff about outages through the tools that just failed: an all-staff email that never arrives, a Teams post that can’t load the channel. Some got it right anyway. Michigan’s Department of Technology, Management and Budget posted a system outage alert warning that state email was down and responses would be delayed, which set expectations for thousands of people in one message.
Run the exercise for your own stack. List every channel you’d use during an incident, including paging, the incident chat, the status page and the internal announcement, and next to each one write the systems it depends on. Anything that shares a dependency with your most critical service needs a fallback that doesn’t.
Status: Degraded
Impact: Some users can't open email or calendars. Chat and calls are working.
What we know: A dependency is overloaded. We've stopped further servers
  being removed from service and are restoring capacity in stages.
Changed since last update: [one line, or "No change"]
What you can do: Use [chat tool] for urgent messages. Don't reinstall clients.
Next update by: [HH:MM UTC]
Lead with impact in your users’ words, say what still works, and always commit to the next update time.
Nothing in an incident management platform would have stopped Exchange servers failing their health checks. The fix belonged to Microsoft’s engineers, and from the outside they found it under unusually hard conditions. What a platform changes is everything around the fix: how quickly the right person knows, whether forty alerts read as one problem or forty, whether the team stays coordinated across a shift change at hour eight, whether users hear something on schedule, and whether the review afterwards starts from a record or from memory.
Here’s how those stages map to Xurrent IMR, using the same failure mode on a smaller service of your own.
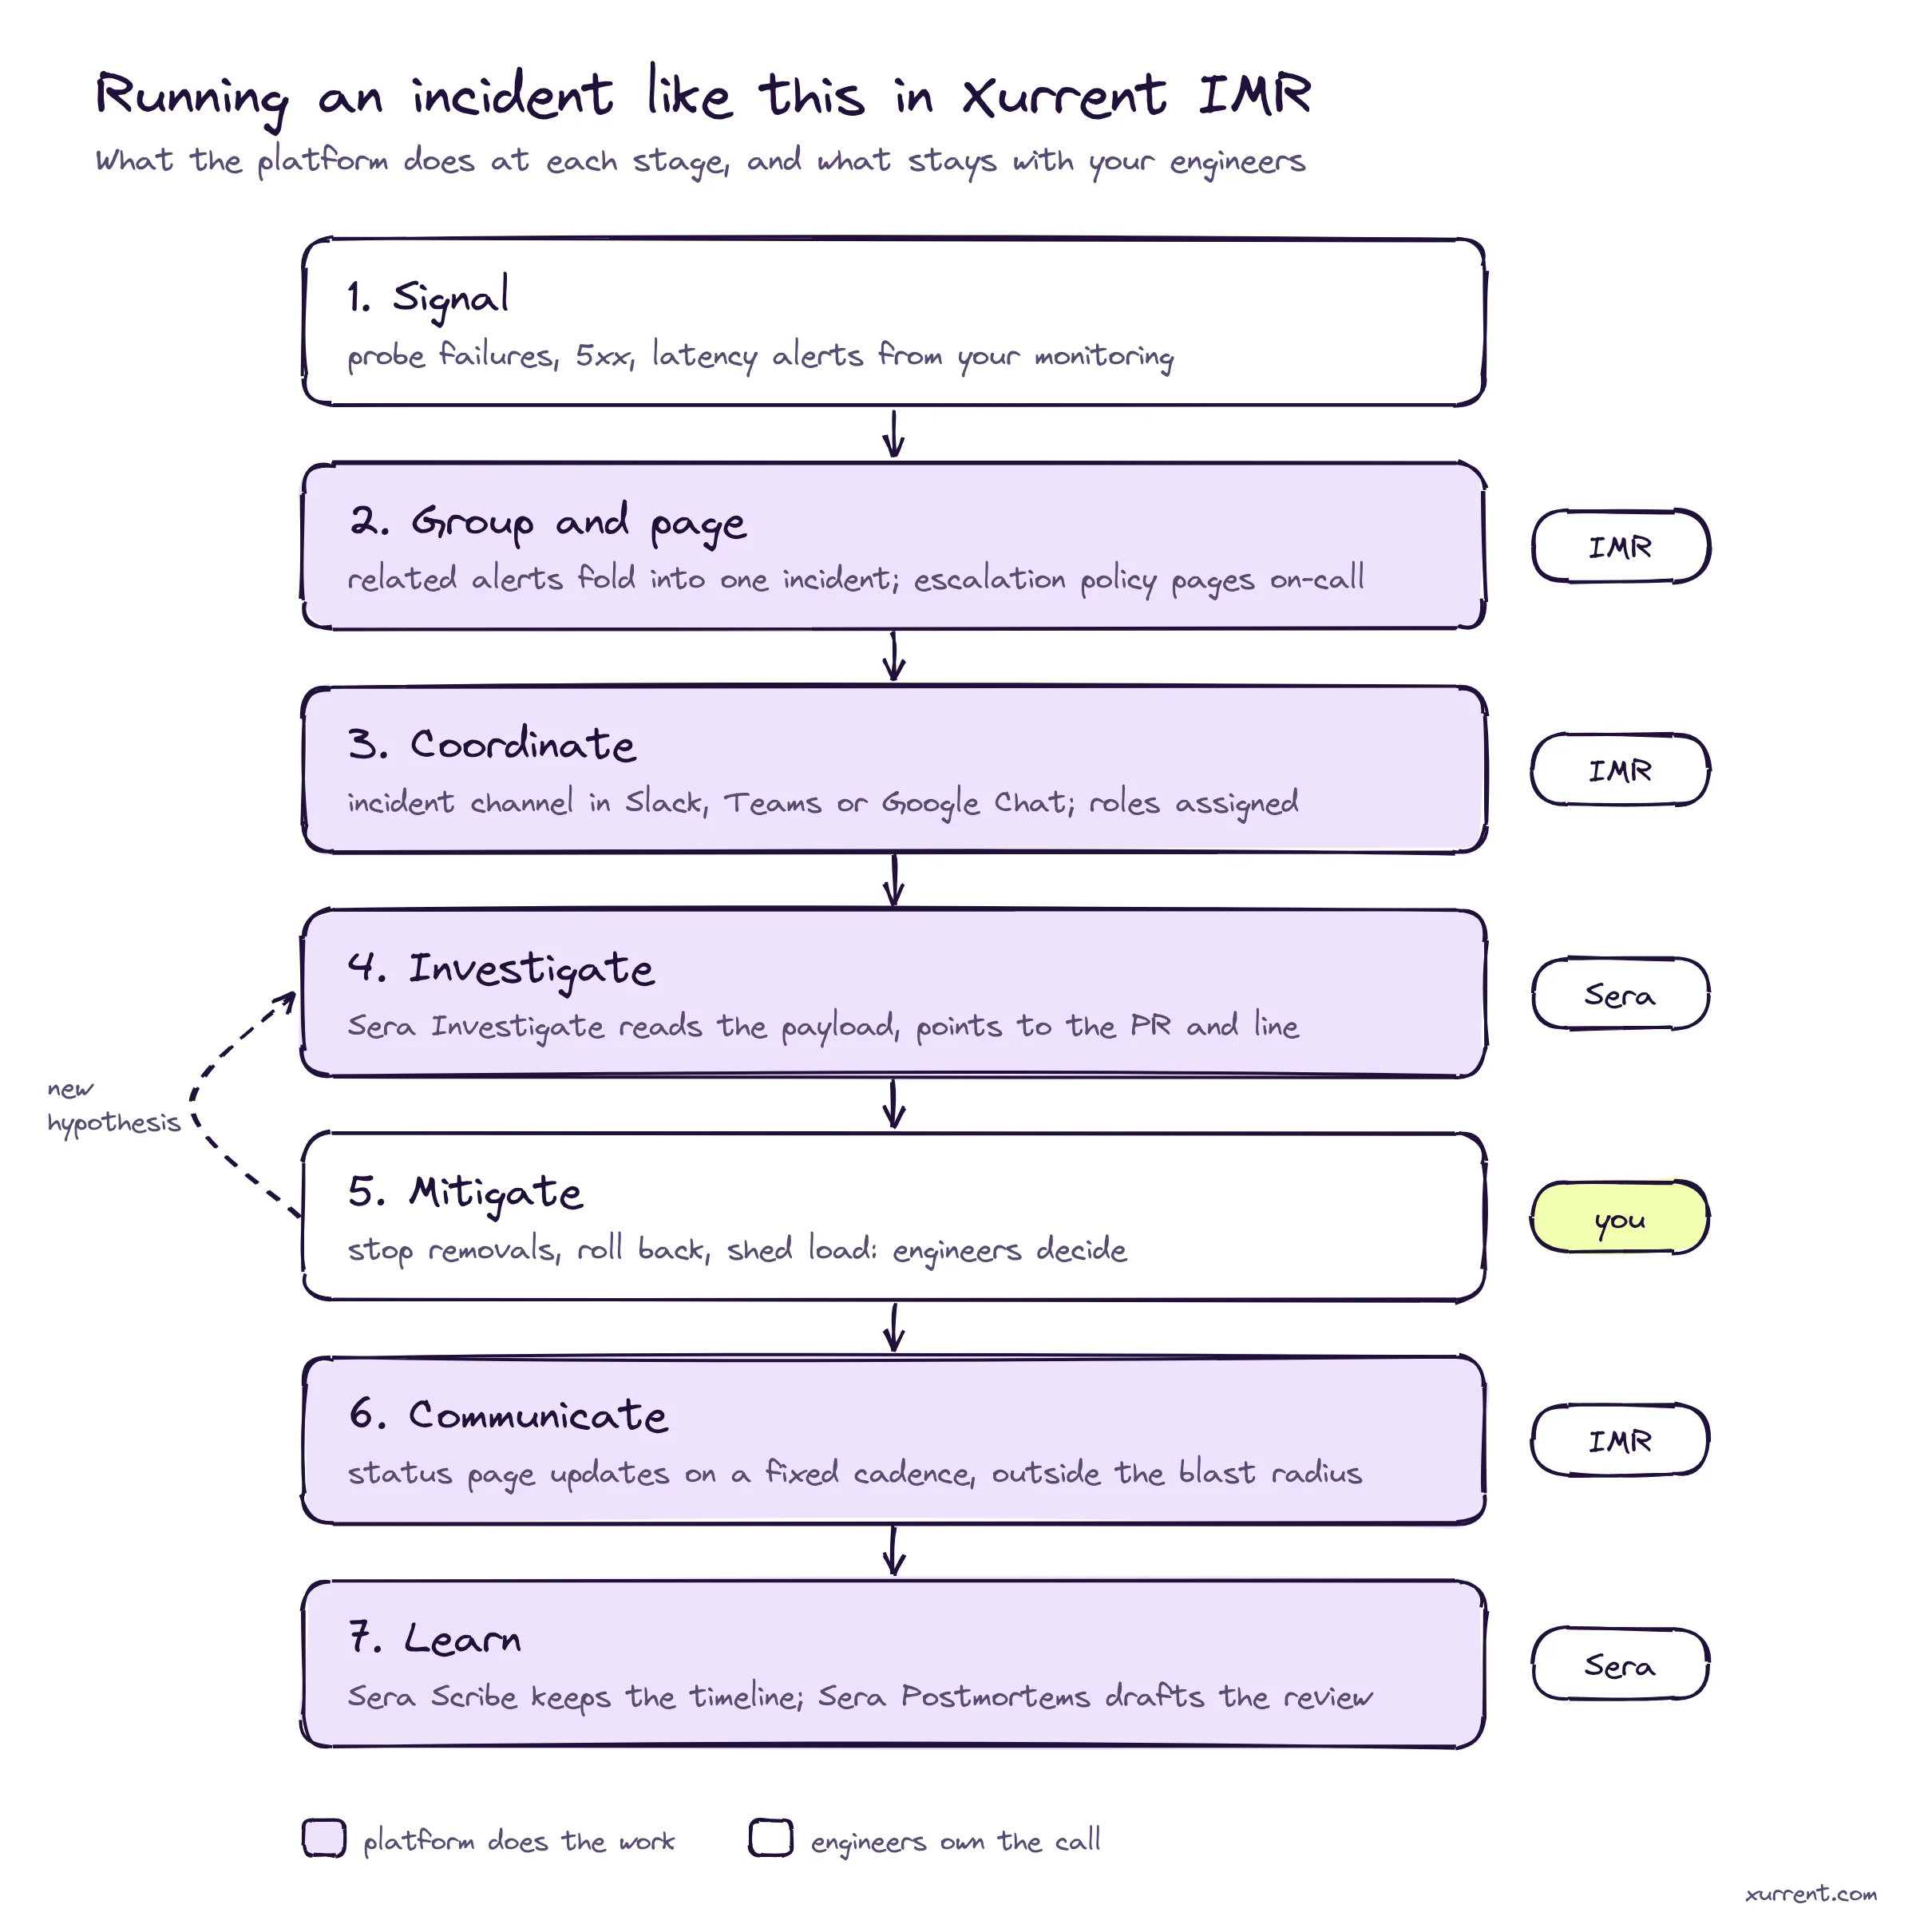
| What you’d see | What IMR does | What your team decides |
|---|---|---|
| Probe failures, 5xx and p99 alerts from dozens of hosts within minutes | Alert grouping folds related alerts into one incident, and the escalation policy pages the on-call engineer for that service. | Severity, and whether this is one problem or several. |
| A response that runs past a shift change | ChatOps opens and runs the incident from Slack, Microsoft Teams or Google Chat, so roles, actions and updates sit in one channel. | Who leads, and when to hand over. |
| A suspicion that a recent change is involved | Sera Investigate reads the alert payload and, with GitHub connected, points to the pull request and line that changed. | Whether to roll back, and what else to rule out. |
| Users and internal teams asking what’s going on | Status pages publish updates from the same place the incident is run, outside your product’s failure domain. | What to say, and the update cadence. |
| A review after a long, messy incident | Sera Scribe keeps the running record, and Sera Postmortems drafts the review from it. | The real causes and the follow-up work. |
To make that concrete, here is what the incident record would look like for a fictional team hitting the same failure mode on their own mail front end. The service, the times and the pull request are invented for illustration; the sequence mirrors the one Microsoft went through.
INC-2291: mail-frontend unavailable
IllustrativeFictional team, service and pull request, used to show the sequence. Your record fills in from your own alerts, channel and deploys.
One caveat worth taking seriously. If your incident chat runs on the same platform that’s failing, as it would have for teams whose response lived in Microsoft Teams during this outage, keep a second channel ready. Xurrent IMR supports Slack, Microsoft Teams and Google Chat for that reason, but the fallback has to be agreed before the incident, not during it.
These are the gaps between what Microsoft has said and a full explanation. We’ll answer them in a follow-up once the review is published.
As of Microsoft’s 07:29 UTC update on 13 November, the incident was still listed as a service degradation, with stability improving where a patch had been applied. Check status.cloud.microsoft for the current state.
Microsoft hasn’t published a root cause. Its updates describe Exchange Online servers failing automated health checks and dropping out of service, the remaining servers overloading, and a process that establishes secure connections becoming overwhelmed. It also rolled back a recent network change that coincided with the start of impact and patched an upstream authentication and routing component.
Microsoft said on 13 November that there was no indication the incident was caused by malicious activity.
Teams calls, meetings and chat don’t depend on Exchange Online, so they largely kept working. Teams features that read from Exchange, such as calendars and meeting scheduling, failed.
Servers Microsoft returned to service became unresponsive again once traffic reached them. In a long overload, retries and reconnecting clients build a backlog that hits any capacity the moment it comes back, so recovery has to be staged: limit traffic, admit it in steps, and widen only when each step holds.
Microsoft’s online services SLA commits to 99.9% monthly uptime for Exchange Online, and credits aren’t applied automatically. Admins open a service request in the Microsoft 365 admin center with the incident IDs, the affected period and user count. LazyAdmin has a good walkthrough of the tiers and deadline.
Declare an incident even though the cause is external, name someone to lead it, tell users what still works, and post updates on a fixed schedule from a channel that doesn’t depend on the vendor that’s down.
See the full incident lifecycle in Xurrent IMR
Alert grouping, on-call, Sera investigation and status pages in one walkthrough with our team.
Analysis based on Microsoft’s public status updates. Microsoft has not confirmed a root cause; we’ll correct anything its post-incident review contradicts.


Google's 2025 DORA report found that 90% of technology professionals now use AI at work, and more than 80% say it has made them more productive. With code assistants and agents, the speed at which code gets written has changed more in eighteen months than in the decade before.