.webp)


Blog
Insights & updates from our experts
Resolve issues quickly with an AI-powered system that automates ticketing.

Resolve issues quickly with an AI-powered system that automates ticketing.

Resolve issues quickly with an AI-powered system that automates ticketing.

Resolve issues quickly with an AI-powered system that automates ticketing.
Resolve issues quickly with an AI-powered system that automates ticketing.

Resolve issues quickly with an AI-powered system that automates ticketing.

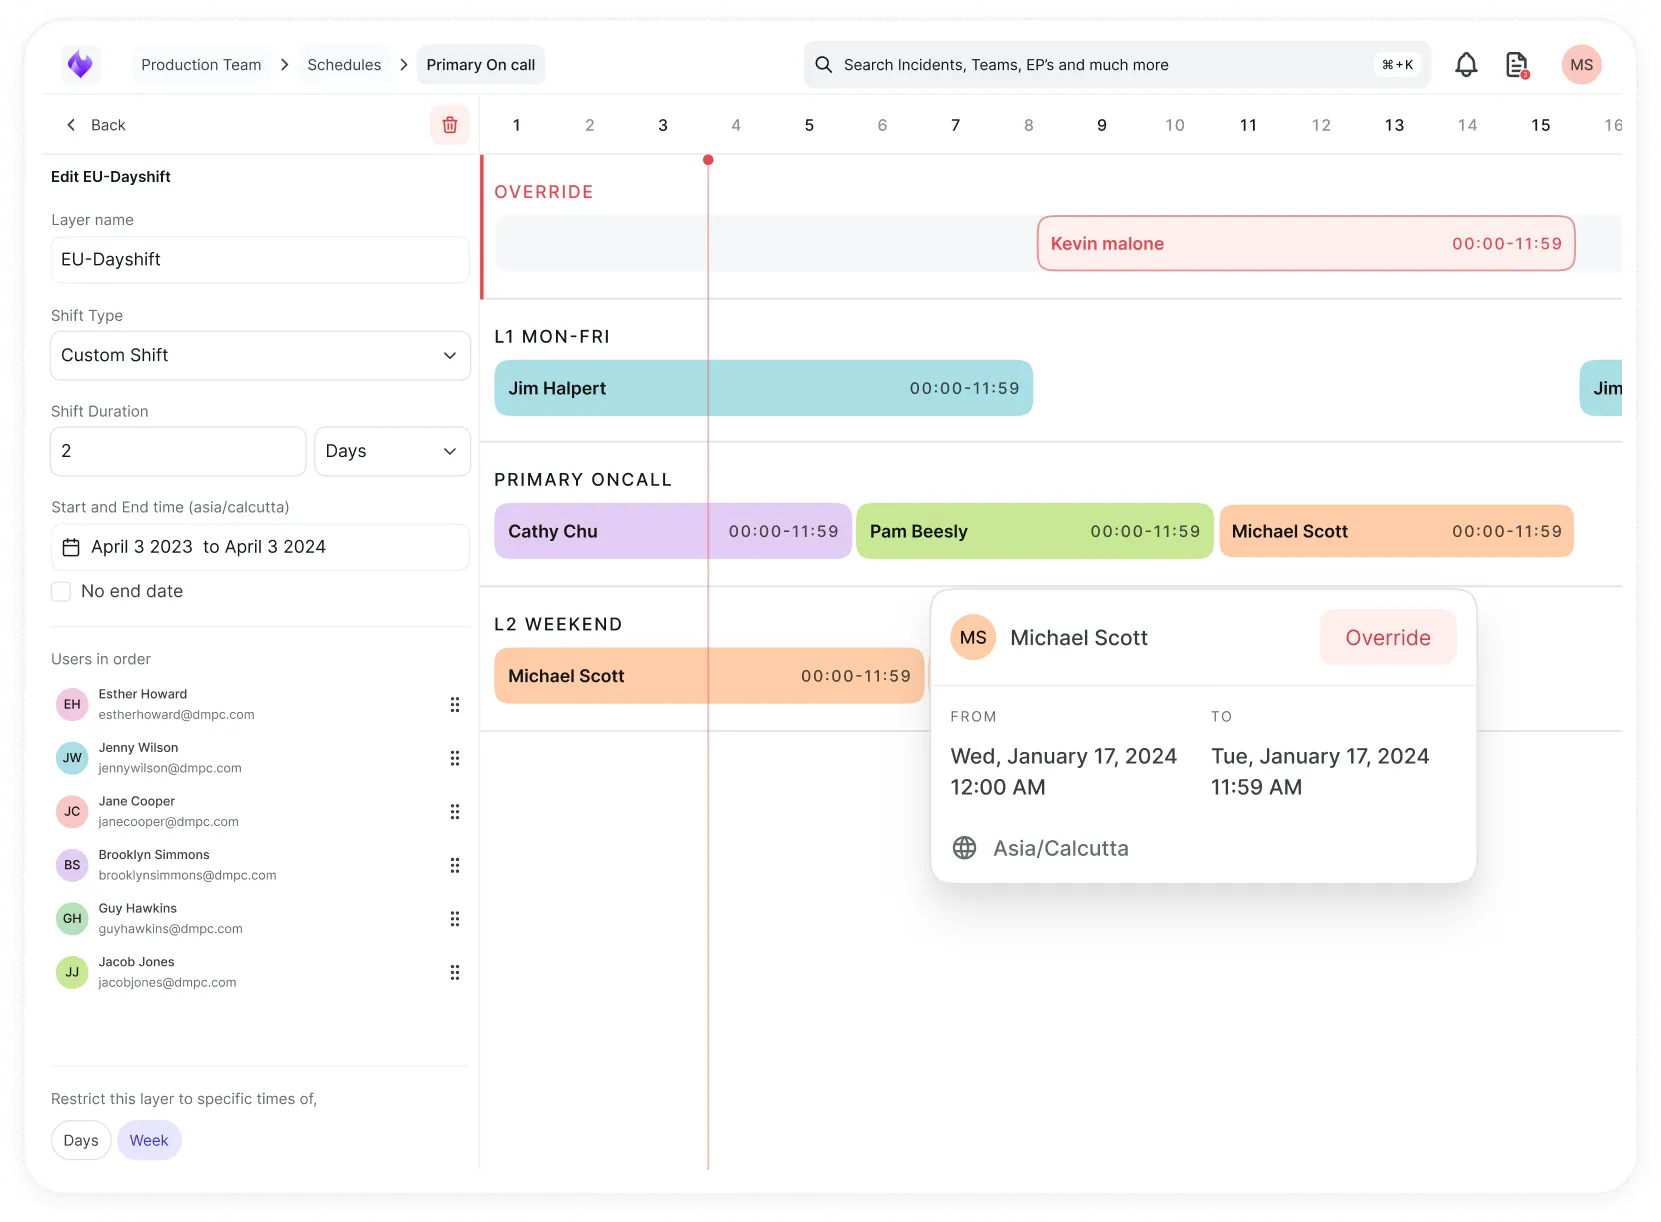
Simplify on-call scheduling, automate escalations, and reduce burnout.
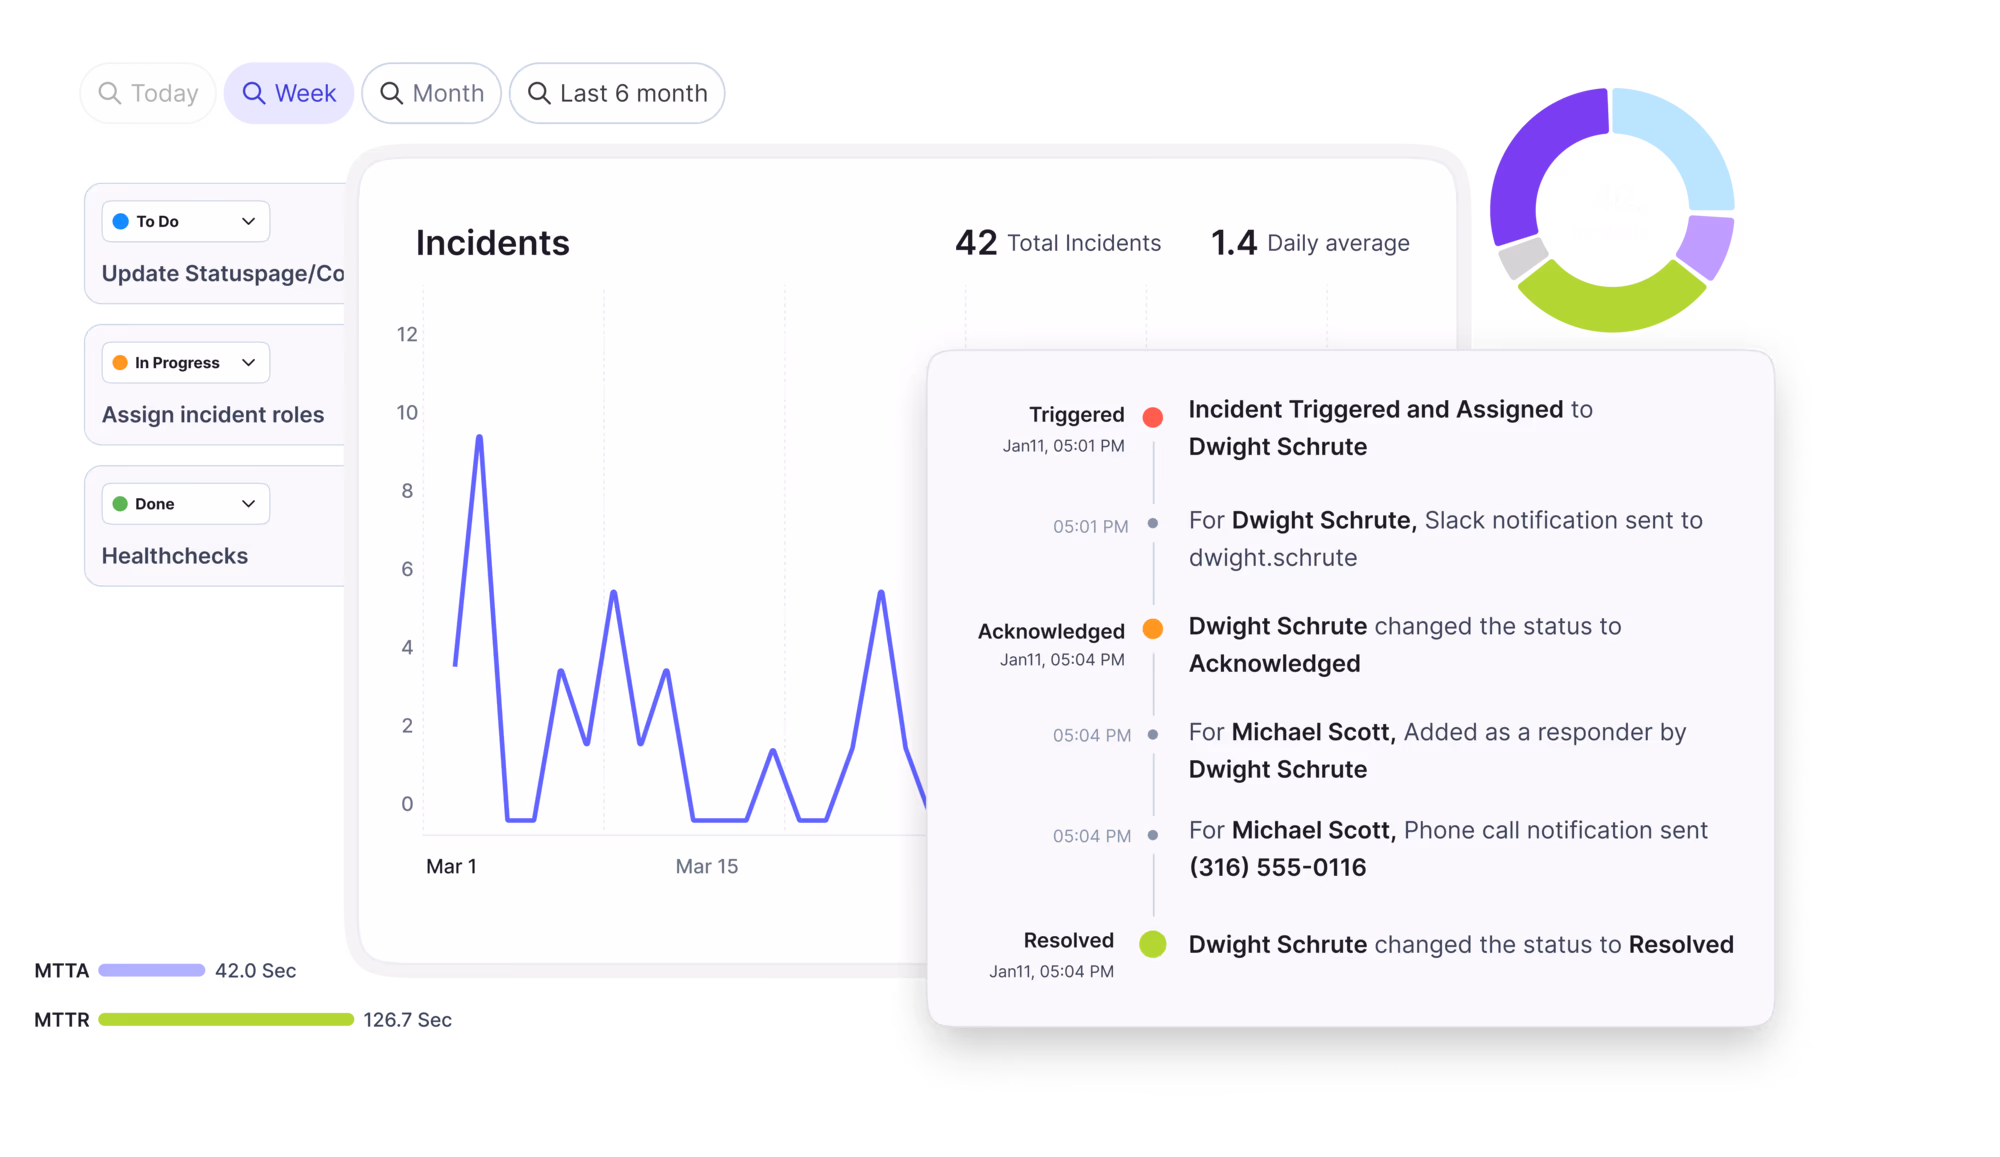
Automate postmortems, AI summaries, and post-incident workflows
We're here to help

The integration with Atlassian Jira using the Xurrent Integration Service is

The integration with Atlassian Jira using the Xurrent Integration Service is

The integration with Atlassian Jira using the Xurrent Integration Service is

The integration with Atlassian Jira using the Xurrent Integration Service is

The integration with Atlassian Jira using the Xurrent Integration Service is

The integration with Atlassian Jira using the Xurrent Integration Service is

The integration with Atlassian Jira using the Xurrent Integration Service is

The integration with Atlassian Jira using the Xurrent Integration Service is
Resolve issues quickly with an AI-powered system that automates ticketing.
Resolve issues quickly with an AI-powered system that automates ticketing.
Simplify on-call scheduling, automate escalations, and reduce burnout.
Automate postmortems, AI summaries, and post-incident workflows
Resolve issues quickly with an AI-powered system that automates ticketing.
Resolve issues quickly with an AI-powered system that automates ticketing.
Resolve issues quickly with an AI-powered system that automates ticketing.
Resolve issues quickly with an AI-powered system that automates ticketing.

We are here to help 24/7

Connect with other Xurrent Users

Get insights and tips on how to get the most out of Xurrent

Apps, APIs, and updates

Xurrent service functionality
Eliminate manual tasks, optimize workflows, and deliver faster resolutions.
Learn how organizations have reduced downtime, improved 50% MTTA & MTTR, and cut costs with Xurrent IMR.
Discover Xurrent IMR's quick support, bidirectional integrations with Jira and Slack, and more cohesive incident response capabilities compared to Opsgenie.
Understand why users value Xurrent IMR for its intuitive interface, efficient incident alerting, customizable On-call schedules, and escalations.
Mean Time Between Failures (MTBF) is a reliability metric that measures the average operational time elapsed between one failure and the next for repairable systems or components. MTBF applies specifically to assets that can be restored to service after a failure—such as servers, network devices, storage arrays, or software services—and is calculated by dividing total operational time by the number of failures during that period. A server fleet that runs 10,000 hours and experiences 5 failures has an MTBF of 2,000 hours. MTBF is distinct from Mean Time to Failure (MTTF), which measures the lifespan of non-repairable items that are replaced rather than fixed, and from [Mean Time to Repair](/glossary/mean-time-to-repair) (MTTR), which measures how long it takes to restore service once a failure occurs. MTBF originated in hardware reliability engineering but now extends across IT infrastructure, cloud services, and application monitoring, where it informs capacity planning, maintenance schedules, vendor SLAs, and asset lifecycle decisions.
MTBF provides a forward-looking view of system reliability that helps IT and engineering teams anticipate failure rates, plan preventive maintenance, and set realistic uptime expectations. Organizations use MTBF to compare vendor hardware options, justify infrastructure refresh cycles, and calculate the total cost of ownership for critical systems—a storage array with a 50,000-hour MTBF requires replacement or redundancy planning sooner than one rated at 200,000 hours. In ITSM and ITOM environments, MTBF data feeds into availability management, problem management, and change planning, enabling teams to identify chronic failure patterns and prioritize root cause fixes before repeat incidents impact users. For SRE and DevOps teams managing distributed systems, tracking MTBF across service components reveals weak links in the reliability chain and informs error budget allocation and chaos engineering priorities. MTBF also shapes vendor negotiations and support contracts—suppliers with demonstrably higher MTBF can command premium pricing, while low MTBF triggers warranty claims, escalations, or early replacement. Ignoring MTBF leads to reactive firefighting, unplanned downtime, budget overruns from emergency replacements, and eroded user trust when services fail more frequently than expected.
MTBF is calculated by dividing the total operational uptime of a system or component by the number of failures recorded during that period: MTBF = Total Uptime / Number of Failures . If a database cluster runs for 8,760 hours (one year) and experiences 4 unplanned outages, its MTBF is 2,190 hours. The calculation requires clear definitions of what constitutes a "failure"—typically an unplanned interruption requiring repair or restart—and excludes scheduled maintenance windows. MTBF is most meaningful when tracked over statistically significant periods and failure counts; a single failure in 1,000 hours yields an MTBF of 1,000 hours, but that figure carries less confidence than 10 failures across 10,000 hours. Organizations aggregate MTBF data from monitoring tools, ticketing systems, and asset management platforms, then segment by component type, vendor, environment, or service tier to identify reliability trends. MTBF feeds into availability calculations—systems with higher MTBF and lower MTTR achieve better uptime percentages—and informs SLA commitments, since a service with a 500-hour MTBF cannot credibly promise 99.99% availability without redundancy. MTBF also guides predictive maintenance: when a component approaches its expected MTBF threshold, teams schedule proactive replacement during planned change windows rather than waiting for failure during production hours.
- Data center operations teams track MTBF across server generations to inform hardware refresh cycles—if Gen-3 servers show an MTBF of 15,000 hours while Gen-4 models achieve 25,000 hours, the operations team justifies budget for early replacement of Gen-3 assets before failure rates spike, reducing unplanned downtime and emergency procurement costs.
- Managed service providers use MTBF as a vendor selection criterion when sourcing network switches and routers for client environments—a provider compares two models with published MTBF ratings of 100,000 hours versus 150,000 hours, selecting the higher-MTBF option to minimize client-facing incidents and reduce the frequency of on-site technician dispatches.
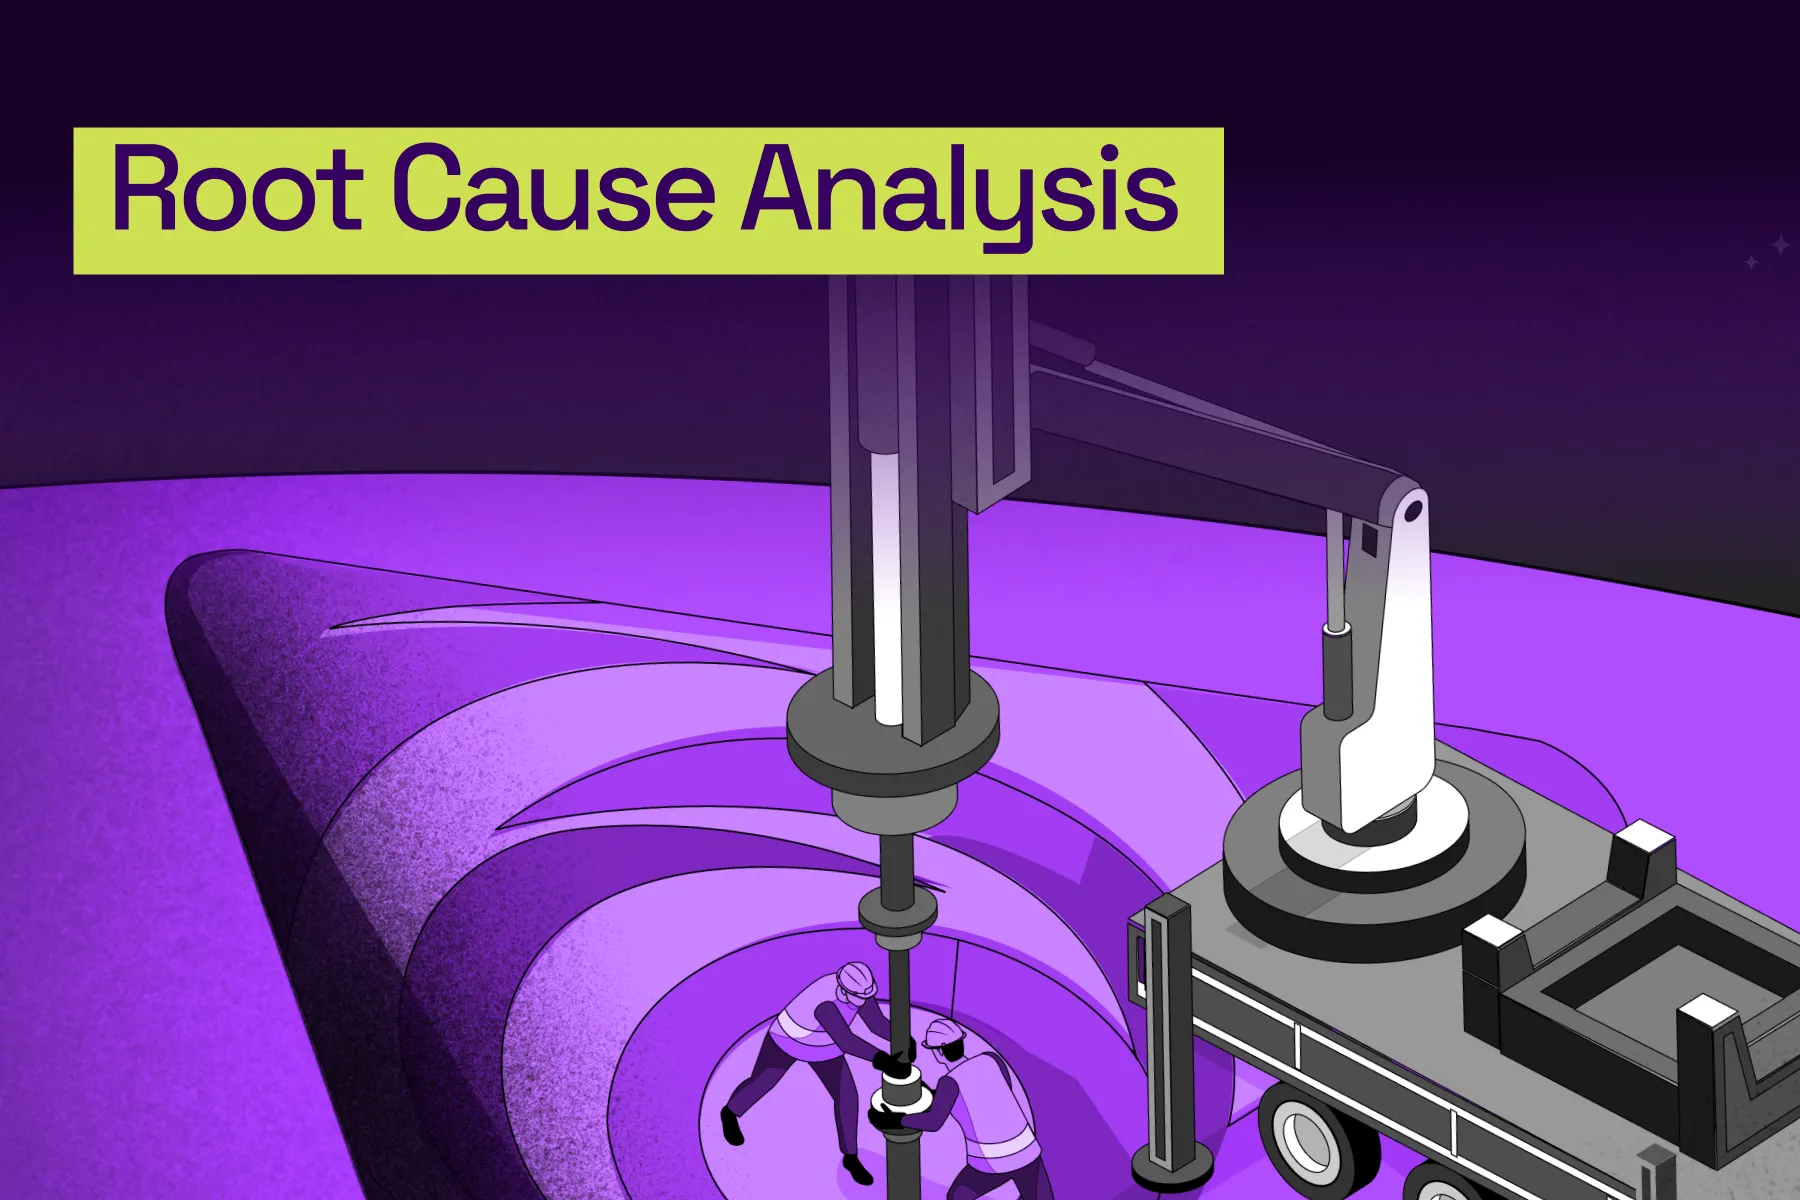
- SRE teams managing microservices architectures calculate MTBF for individual service instances to identify reliability outliers—when one API service shows an MTBF of 200 hours compared to a fleet average of 1,500 hours, the team prioritizes root cause analysis, discovers a memory leak, and deploys a fix that brings the service's MTBF in line with the rest of the platform, improving overall system stability.
- Mean Time to Repair
- Incident Management
- Availability Management
- Problem Management
- Service Level Agreement
---


.webp)
.webp)