.webp)


Blog
Insights & updates from our experts
Resolve issues quickly with an AI-powered system that automates ticketing.

Resolve issues quickly with an AI-powered system that automates ticketing.

Resolve issues quickly with an AI-powered system that automates ticketing.

Resolve issues quickly with an AI-powered system that automates ticketing.
Resolve issues quickly with an AI-powered system that automates ticketing.

Resolve issues quickly with an AI-powered system that automates ticketing.

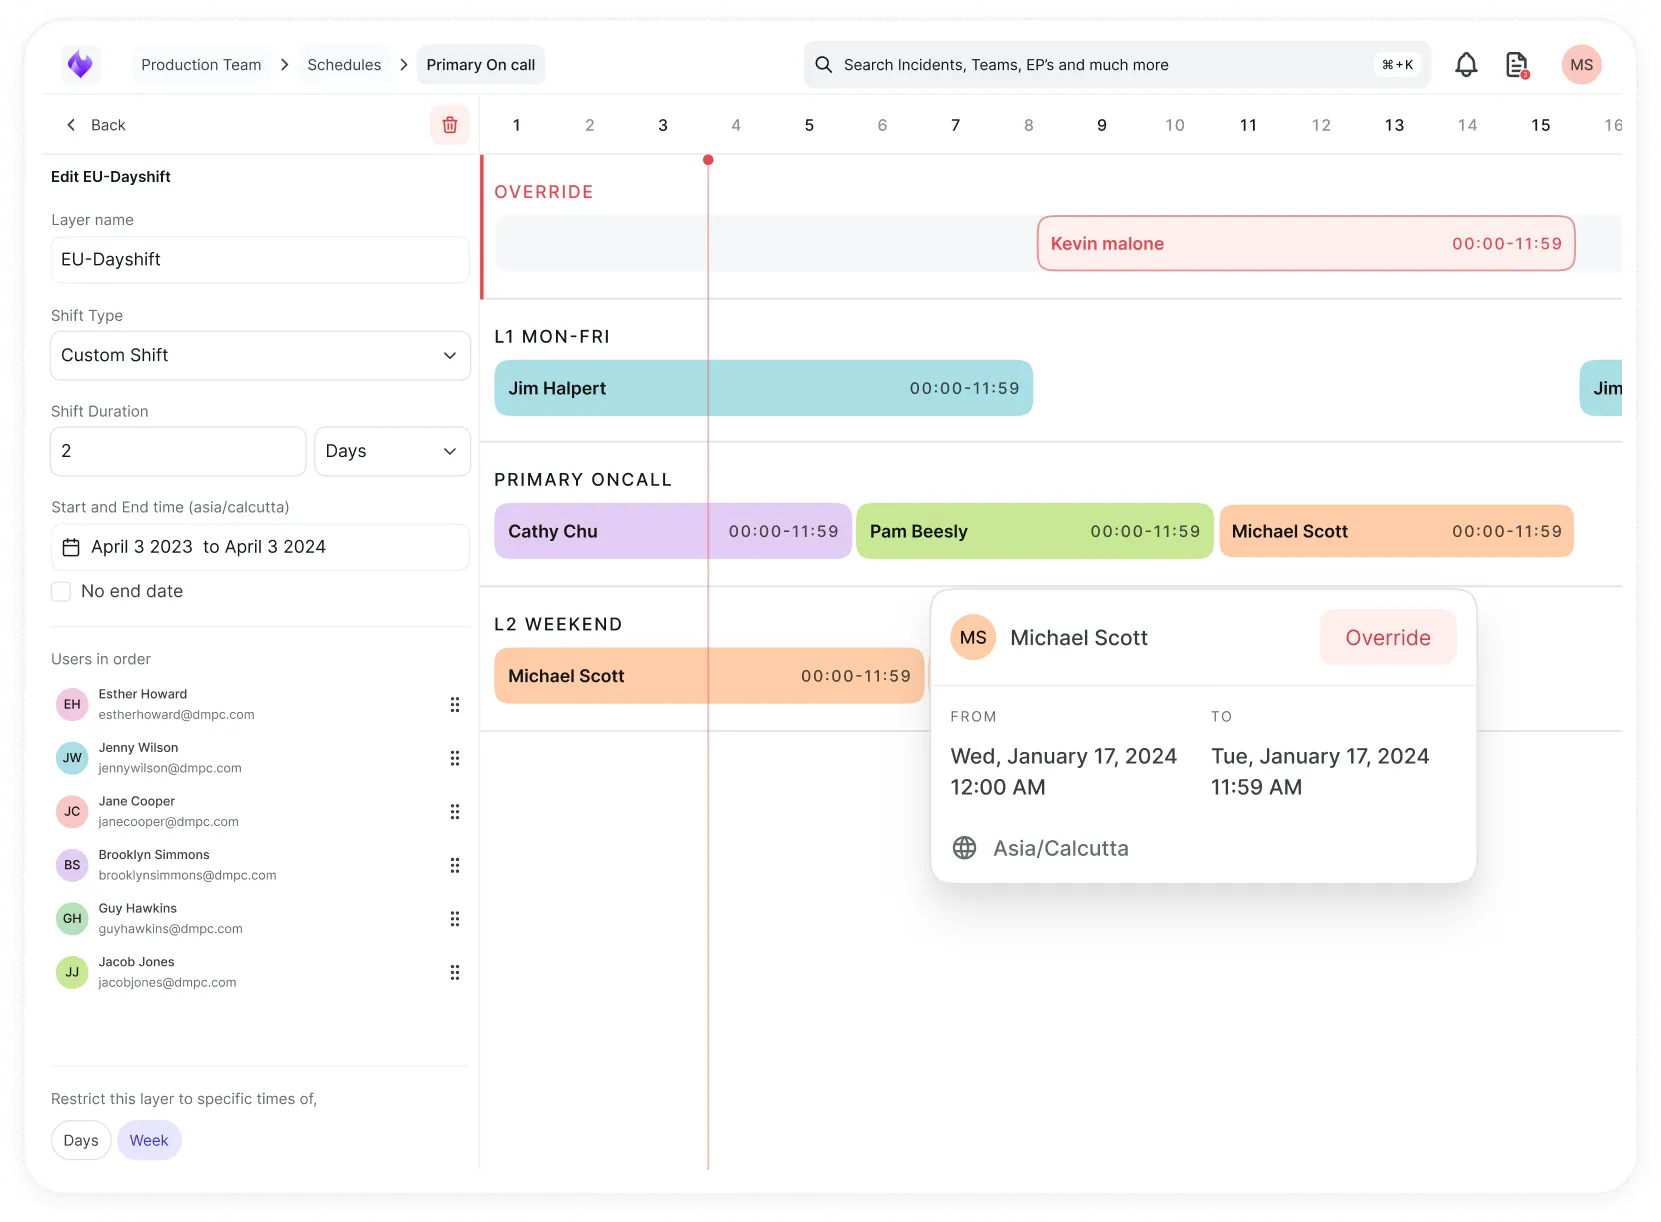
Simplify on-call scheduling, automate escalations, and reduce burnout.
Automate postmortems, AI summaries, and post-incident workflows
We're here to help

The integration with Atlassian Jira using the Xurrent Integration Service is

The integration with Atlassian Jira using the Xurrent Integration Service is

The integration with Atlassian Jira using the Xurrent Integration Service is

The integration with Atlassian Jira using the Xurrent Integration Service is

The integration with Atlassian Jira using the Xurrent Integration Service is

The integration with Atlassian Jira using the Xurrent Integration Service is

The integration with Atlassian Jira using the Xurrent Integration Service is

The integration with Atlassian Jira using the Xurrent Integration Service is
Resolve issues quickly with an AI-powered system that automates ticketing.
Resolve issues quickly with an AI-powered system that automates ticketing.
Simplify on-call scheduling, automate escalations, and reduce burnout.
Automate postmortems, AI summaries, and post-incident workflows
Resolve issues quickly with an AI-powered system that automates ticketing.
Resolve issues quickly with an AI-powered system that automates ticketing.
Resolve issues quickly with an AI-powered system that automates ticketing.
Resolve issues quickly with an AI-powered system that automates ticketing.

We are here to help 24/7

Connect with other Xurrent Users

Get insights and tips on how to get the most out of Xurrent

Apps, APIs, and updates

Xurrent service functionality
Eliminate manual tasks, optimize workflows, and deliver faster resolutions.
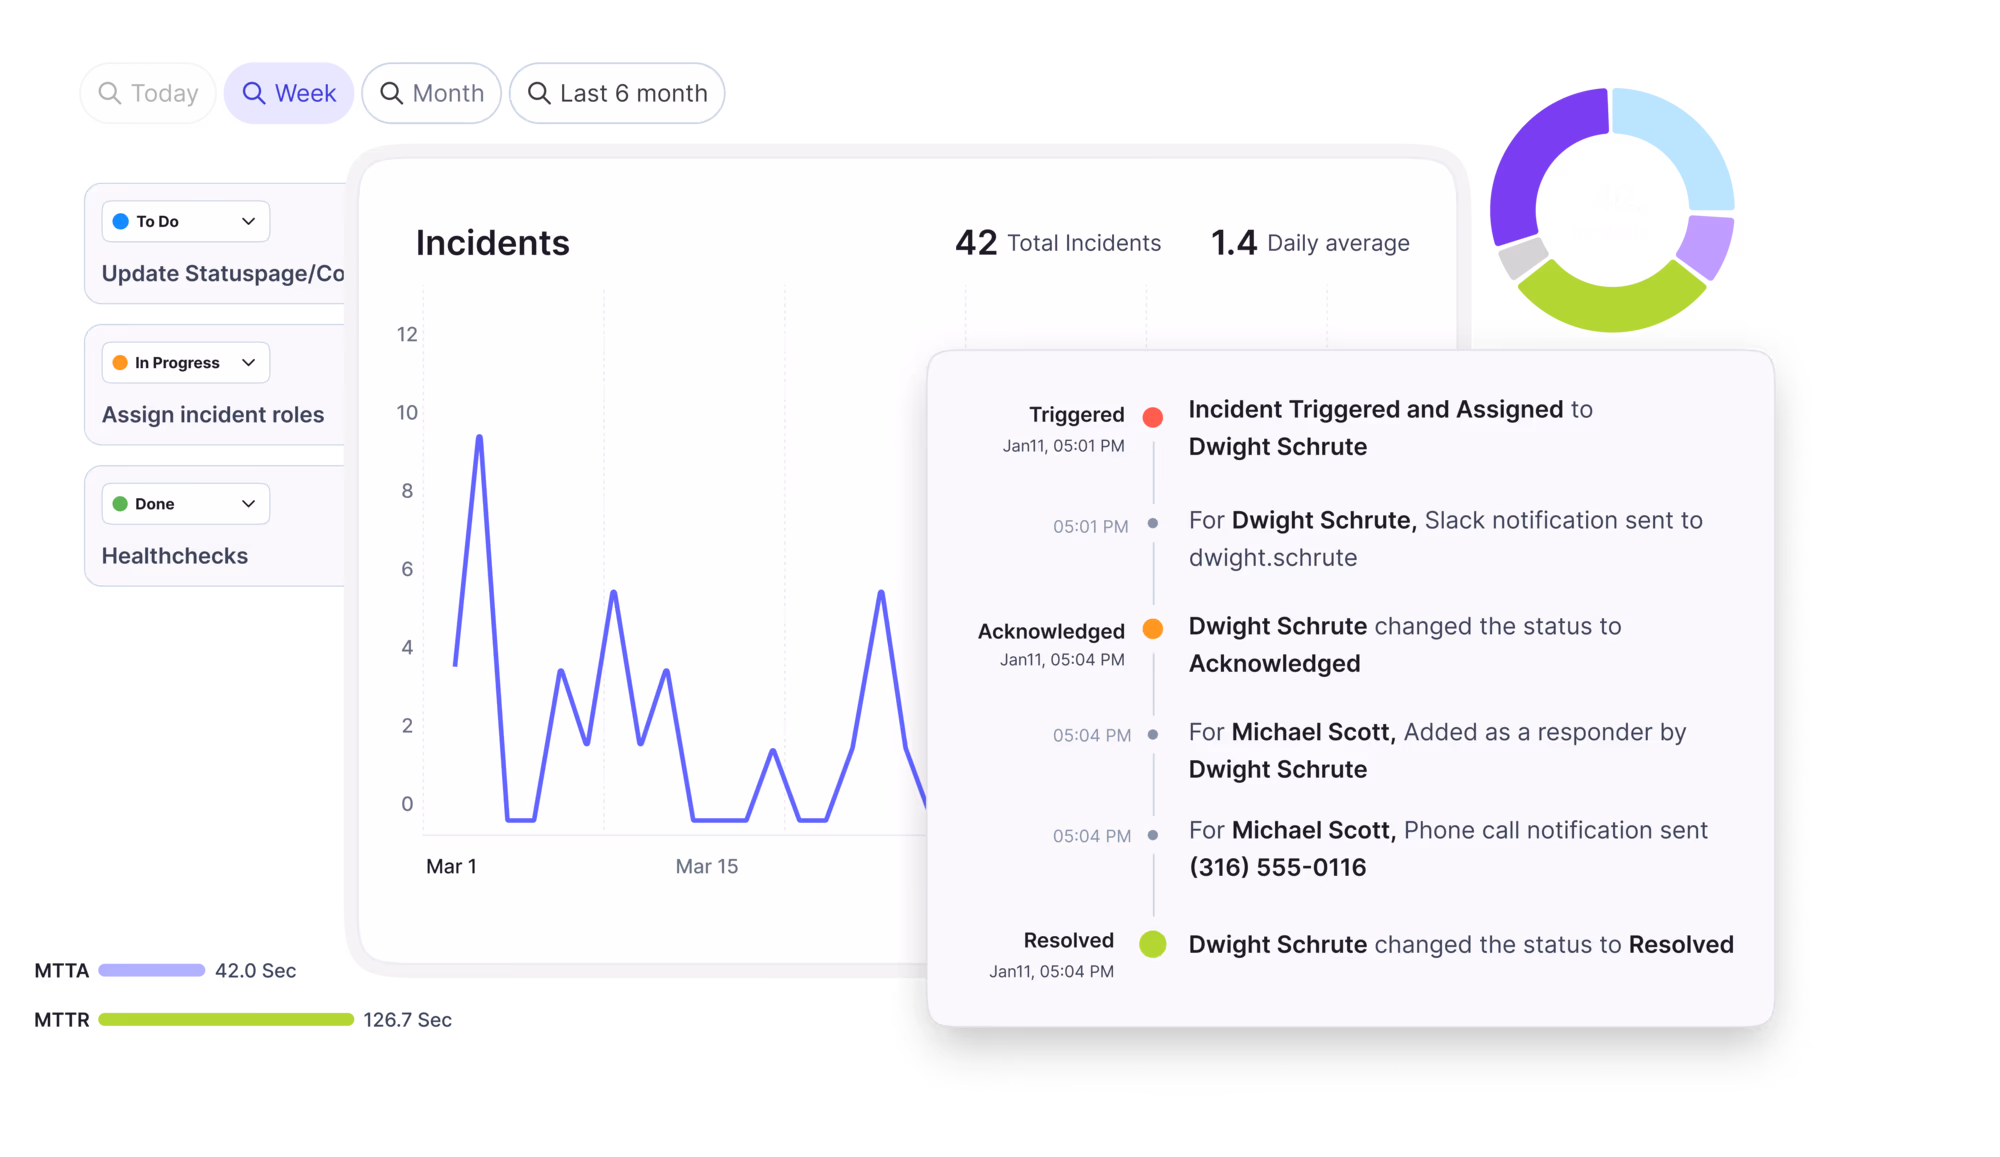
Learn how organizations have reduced downtime, improved 50% MTTA & MTTR, and cut costs with Xurrent IMR.
Discover Xurrent IMR's quick support, bidirectional integrations with Jira and Slack, and more cohesive incident response capabilities compared to Opsgenie.
Understand why users value Xurrent IMR for its intuitive interface, efficient incident alerting, customizable On-call schedules, and escalations.
A Service Level Indicator (SLI) is a quantifiable metric that measures a specific aspect of service performance from the user's perspective. SLIs track real system behavior—such as request latency, error rate, availability, or throughput—and provide the raw data used to evaluate whether a service meets its reliability and performance commitments. Unlike broader service-level concepts, an SLI is a single, measurable signal: the percentage of requests completed in under 200ms, the ratio of successful API calls to total calls, or the uptime of a critical application over a rolling 30-day window. SLIs are the foundation of Service Level Objectives (SLOs), which define target values or acceptable ranges for these indicators, and Service Level Agreements (SLAs), which formalize performance guarantees with customers or internal stakeholders.
In ITSM and ITOM contexts, SLIs are often tied to incident response, change success rates, and service desk resolution times. In SRE and DevOps environments, SLIs focus on application-layer metrics like request success rate, latency percentiles, and system availability. Regardless of domain, an effective SLI must be user-centric, measurable from production systems, and directly tied to business or operational outcomes.
Service Level Indicators provide the objective, real-time data needed to manage service reliability, prioritize engineering work, and maintain trust with users and stakeholders. Without clearly defined SLIs, teams operate on intuition or anecdotal evidence, leading to misaligned priorities, undetected degradation, and reactive firefighting. SLIs make service health visible: they reveal whether a service is meeting user expectations, where performance is degrading, and which incidents or changes have the greatest impact on reliability.
For IT operations and service desk teams, SLIs tied to incident resolution time, first-contact resolution rate, or change success rate enable data-driven process improvement and SLA compliance. For SRE and DevOps teams, SLIs like error budget consumption, latency at the 95th percentile, and availability over time inform release decisions, capacity planning, and incident prioritization. When SLIs are poorly chosen—tracking internal system metrics that don't reflect user experience, or measuring too many signals without clear prioritization—teams drown in noise, miss critical issues, and lose the ability to distinguish signal from alert fatigue.
SLIs also underpin accountability and continuous improvement. By tracking SLI trends over time, organizations can measure the impact of automation, infrastructure changes, and process standardization. When SLIs are tied to SLOs and communicated transparently via dashboards or status pages, they build confidence across engineering, operations, and executive leadership.
Defining and implementing a Service Level Indicator follows a structured process that begins with identifying what matters most to users. Teams start by selecting a service or system component, then determine which aspects of performance directly affect user experience—such as availability, speed, correctness, or durability. The SLI is expressed as a ratio or percentage: successful events divided by total events over a defined time window. For example, an availability SLI might measure the percentage of time a service responds to health checks successfully over the past 30 days, while a latency SLI tracks the proportion of requests completed within a target threshold.
Once defined, the SLI is instrumented using monitoring and observability tools that collect real-time data from production systems—application logs, API response times, synthetic probes, or user-facing transaction traces. The data is aggregated and calculated continuously, often visualized in dashboards and tracked against SLO targets. When an SLI falls below its objective, it triggers alerts, incident workflows, or error budget policies that guide response prioritization.
SLIs are typically reviewed and refined over time. Teams validate that the chosen metric correlates with actual user satisfaction, adjust measurement windows to balance responsiveness and stability, and retire SLIs that no longer reflect business priorities. In mature organizations, SLIs are integrated into change management, release gates, and postmortem processes, ensuring that every operational decision is grounded in measurable service performance.
- E-commerce checkout availability : An online retailer tracks the percentage of successful checkout transactions over a rolling 7-day window as an SLI. If the SLI drops below 99.5%, it signals a potential issue with payment processing, inventory systems, or frontend availability, triggering an incident response workflow and automated rollback if a recent deployment is identified as the cause.
- IT service desk resolution time : A mid-sized enterprise measures the percentage of incidents resolved within 4 hours as an SLI for its internal service desk. This metric is tied to an SLO of 85% compliance and reported monthly to IT leadership. When the SLI trends downward, it prompts process reviews, staffing adjustments, or automation investments to improve first-contact resolution rates.
- API request latency for SaaS platform : A B2B SaaS provider defines an SLI that tracks the percentage of API requests completed in under 300ms at the 95th percentile. This SLI is monitored in real time, integrated into release pipelines, and used to calculate error budget consumption. If latency SLI degrades after a new feature release, the team halts further deployments and prioritizes performance optimization before resuming new work.
- Service Level Objective
- Service Level Agreement
- Service Level Management
- Mean Time to Repair
- KPI (Key Performance Indicator
---

.webp)
.webp)