.webp)


Blog
Insights & updates from our experts
Resolve issues quickly with an AI-powered system that automates ticketing.

Resolve issues quickly with an AI-powered system that automates ticketing.

Resolve issues quickly with an AI-powered system that automates ticketing.

Resolve issues quickly with an AI-powered system that automates ticketing.
Resolve issues quickly with an AI-powered system that automates ticketing.

Resolve issues quickly with an AI-powered system that automates ticketing.

Simplify on-call scheduling, automate escalations, and reduce burnout.
Automate postmortems, AI summaries, and post-incident workflows
We're here to help

The integration with Atlassian Jira using the Xurrent Integration Service is

The integration with Atlassian Jira using the Xurrent Integration Service is

The integration with Atlassian Jira using the Xurrent Integration Service is

The integration with Atlassian Jira using the Xurrent Integration Service is

The integration with Atlassian Jira using the Xurrent Integration Service is

The integration with Atlassian Jira using the Xurrent Integration Service is

The integration with Atlassian Jira using the Xurrent Integration Service is

The integration with Atlassian Jira using the Xurrent Integration Service is
Resolve issues quickly with an AI-powered system that automates ticketing.
Resolve issues quickly with an AI-powered system that automates ticketing.
Simplify on-call scheduling, automate escalations, and reduce burnout.
Automate postmortems, AI summaries, and post-incident workflows
Resolve issues quickly with an AI-powered system that automates ticketing.
Resolve issues quickly with an AI-powered system that automates ticketing.
Resolve issues quickly with an AI-powered system that automates ticketing.
Resolve issues quickly with an AI-powered system that automates ticketing.

We are here to help 24/7

Connect with other Xurrent Users

Get insights and tips on how to get the most out of Xurrent

Apps, APIs, and updates

Xurrent service functionality
Eliminate manual tasks, optimize workflows, and deliver faster resolutions.
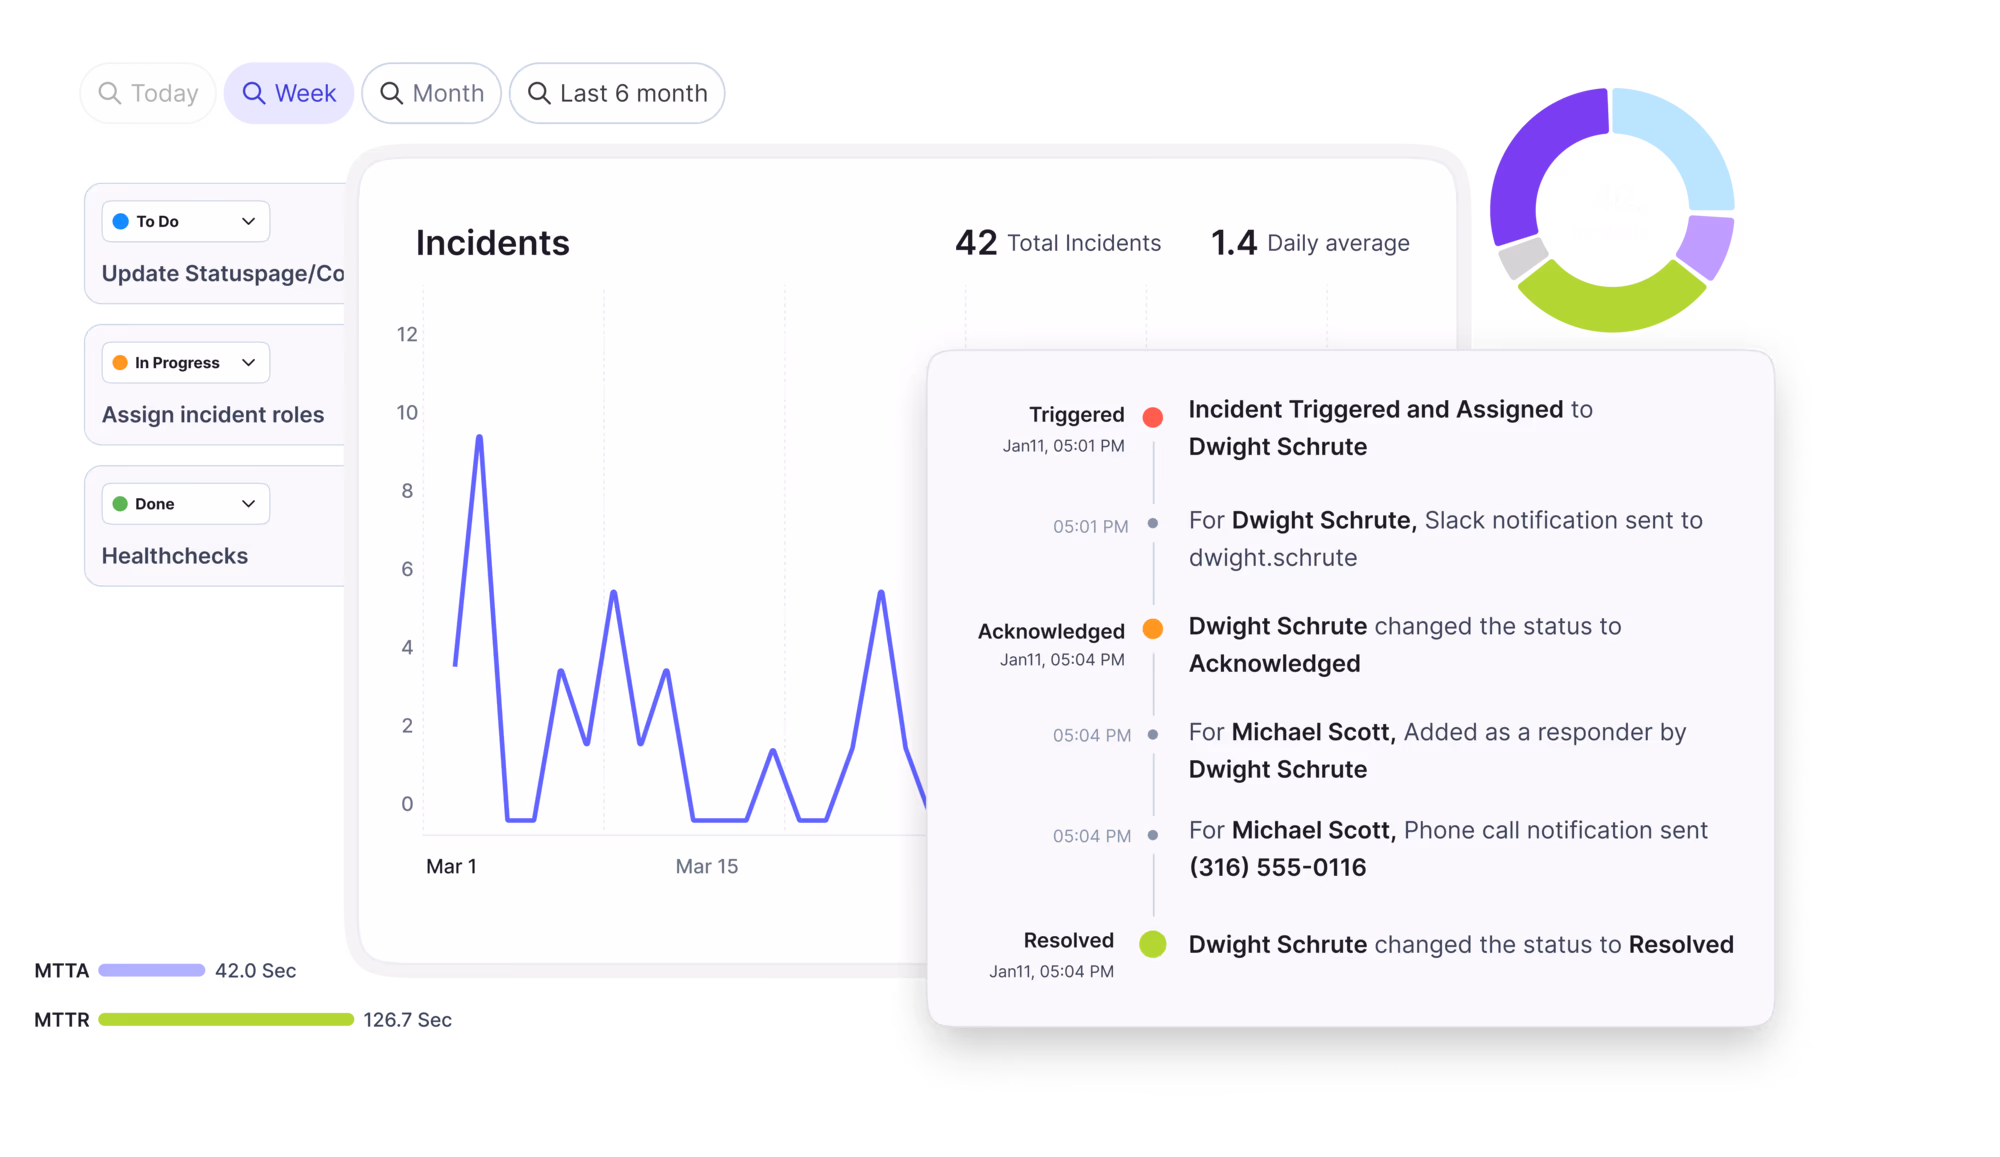
Learn how organizations have reduced downtime, improved 50% MTTA & MTTR, and cut costs with Xurrent IMR.
Discover Xurrent IMR's quick support, bidirectional integrations with Jira and Slack, and more cohesive incident response capabilities compared to Opsgenie.
Understand why users value Xurrent IMR for its intuitive interface, efficient incident alerting, customizable On-call schedules, and escalations.
A KPI (Key Performance Indicator) is a quantifiable metric that measures how effectively a service, process, or team is achieving specific business or operational objectives over time. In ITSM and incident management contexts, KPIs translate strategic goals—such as reducing downtime, improving user satisfaction, or accelerating resolution—into measurable values that teams track continuously to assess performance, identify trends, and drive improvement. Unlike general metrics that simply record activity, KPIs are deliberately selected to reflect progress toward outcomes that matter to the organization, such as service availability, response speed, or compliance adherence.
KPIs provide a shared language for accountability across IT operations, service desks, SRE teams, and business stakeholders. They answer whether services are meeting agreed standards, whether incidents are being resolved within acceptable timeframes, and whether operational investments are delivering the intended results. In platforms like Xurrent, KPIs are often visualized through real-time dashboards and automated reports, enabling leaders to monitor SLA performance, track MTTR trends, and measure first-contact resolution rates without manual data aggregation.
KPIs matter because they convert operational activity into business-relevant insight. Without defined KPIs, IT and engineering teams operate reactively, unable to prove service quality, justify resource allocation, or demonstrate continuous improvement to executives. When incidents occur, KPIs like MTTR and incident recurrence rate reveal whether response processes are effective or whether root causes remain unaddressed. When service requests pile up, KPIs such as first-contact resolution and average handling time expose bottlenecks in workflows or knowledge gaps on the service desk.
For organizations managing SLAs, KPIs provide the evidence needed to validate compliance and identify breaches before they escalate. In ITSM, tracking KPIs like ticket volume by category, SLA adherence percentage, and customer satisfaction scores enables service managers to allocate staff effectively, prioritize automation opportunities, and align IT delivery with business expectations. In incident management, KPIs such as alert-to-acknowledge time, mean time to detect, and postmortem completion rate help SRE and DevOps teams reduce alert fatigue, improve on-call accountability, and prevent repeat outages.
Failing to track the right KPIs leads to misaligned priorities, undetected performance degradation, and missed opportunities for optimization. Teams may resolve incidents quickly but fail to address underlying problems, or they may meet ticket closure targets while user satisfaction declines. KPIs ensure that effort translates into measurable value.
KPIs work by establishing a baseline, setting a target, and measuring progress at regular intervals. The process begins with defining strategic objectives—for example, improving service availability or reducing incident impact. Teams then select specific, quantifiable indicators that directly reflect those objectives, such as uptime percentage, mean time to repair, or percentage of incidents resolved within SLA.
Once defined, KPIs are tracked through automated data collection from ITSM platforms, monitoring tools, and incident management systems. In Xurrent ITSM, for instance, KPI data flows from ticket workflows, SLA timers, and user feedback forms into centralized dashboards and reports. Thresholds and targets are configured to trigger alerts when performance deviates from acceptable ranges—such as when MTTR exceeds historical averages or when SLA breaches spike.
Teams review KPIs during regular operational reviews, postmortems, and executive reporting cycles. Trends are analyzed to identify patterns: Are incidents clustering around specific services? Is first-contact resolution declining in certain regions? Are on-call response times improving after process changes? This analysis informs decisions about staffing, training, automation investments, and process adjustments.
Effective KPI programs also distinguish between leading indicators—metrics that predict future performance, such as open incident count or backlog age—and lagging indicators—metrics that confirm past outcomes, such as total downtime or customer satisfaction scores. Both types are necessary for proactive management and accountability.
- Mean Time to Repair (MTTR) for a SaaS provider : An online collaboration platform tracks MTTR across all production incidents to measure how quickly engineering teams restore service after outages. When MTTR begins trending upward, the SRE team investigates whether alert noise, unclear runbooks, or insufficient on-call coverage is delaying response, then implements targeted improvements such as automated incident routing and postmortem action tracking.
- First Contact Resolution (FCR) for an enterprise service desk : A multinational manufacturer measures the percentage of IT service requests resolved during the initial interaction with the service desk. When FCR drops below 70%, the IT manager identifies knowledge gaps in the service catalog and invests in AI-assisted knowledge management and self-service portal enhancements, ultimately improving FCR to 85% and reducing ticket escalations by 40%.
- SLA Adherence Rate for a managed service provider : An MSP serving mid-market clients tracks the percentage of incidents and requests resolved within contractual SLA timeframes across all client accounts. Monthly KPI reports reveal that one client consistently experiences SLA breaches due to delayed escalations, prompting the MSP to configure automated escalation policies and real-time SLA dashboards in Xurrent, restoring compliance and strengthening client trust.
- MTTR (Mean Time to Repair)
- SLA (Service Level Agreement)
- FCR (First Contact Resolution)
- CSAT (Customer Satisfaction)
- Service Level Management
---

.webp)
.webp)