





Blog
Insights & updates from our experts


Resolve plant floor and IT issues before they disrupt production.

Stay audit-ready while resolving issues and reducing operational risk.
Resolve issues quickly with an AI-powered system that automates ticketing.
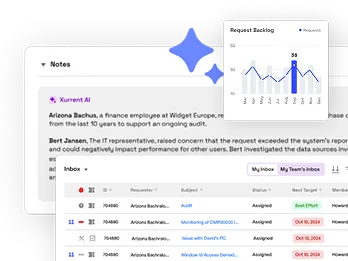
Unifiy IT, HR, Facilities, Finance, and more on a single, AI-powered service platform.
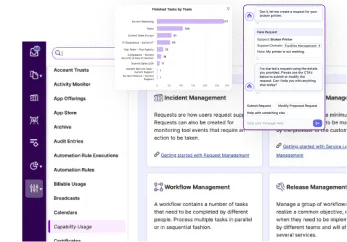
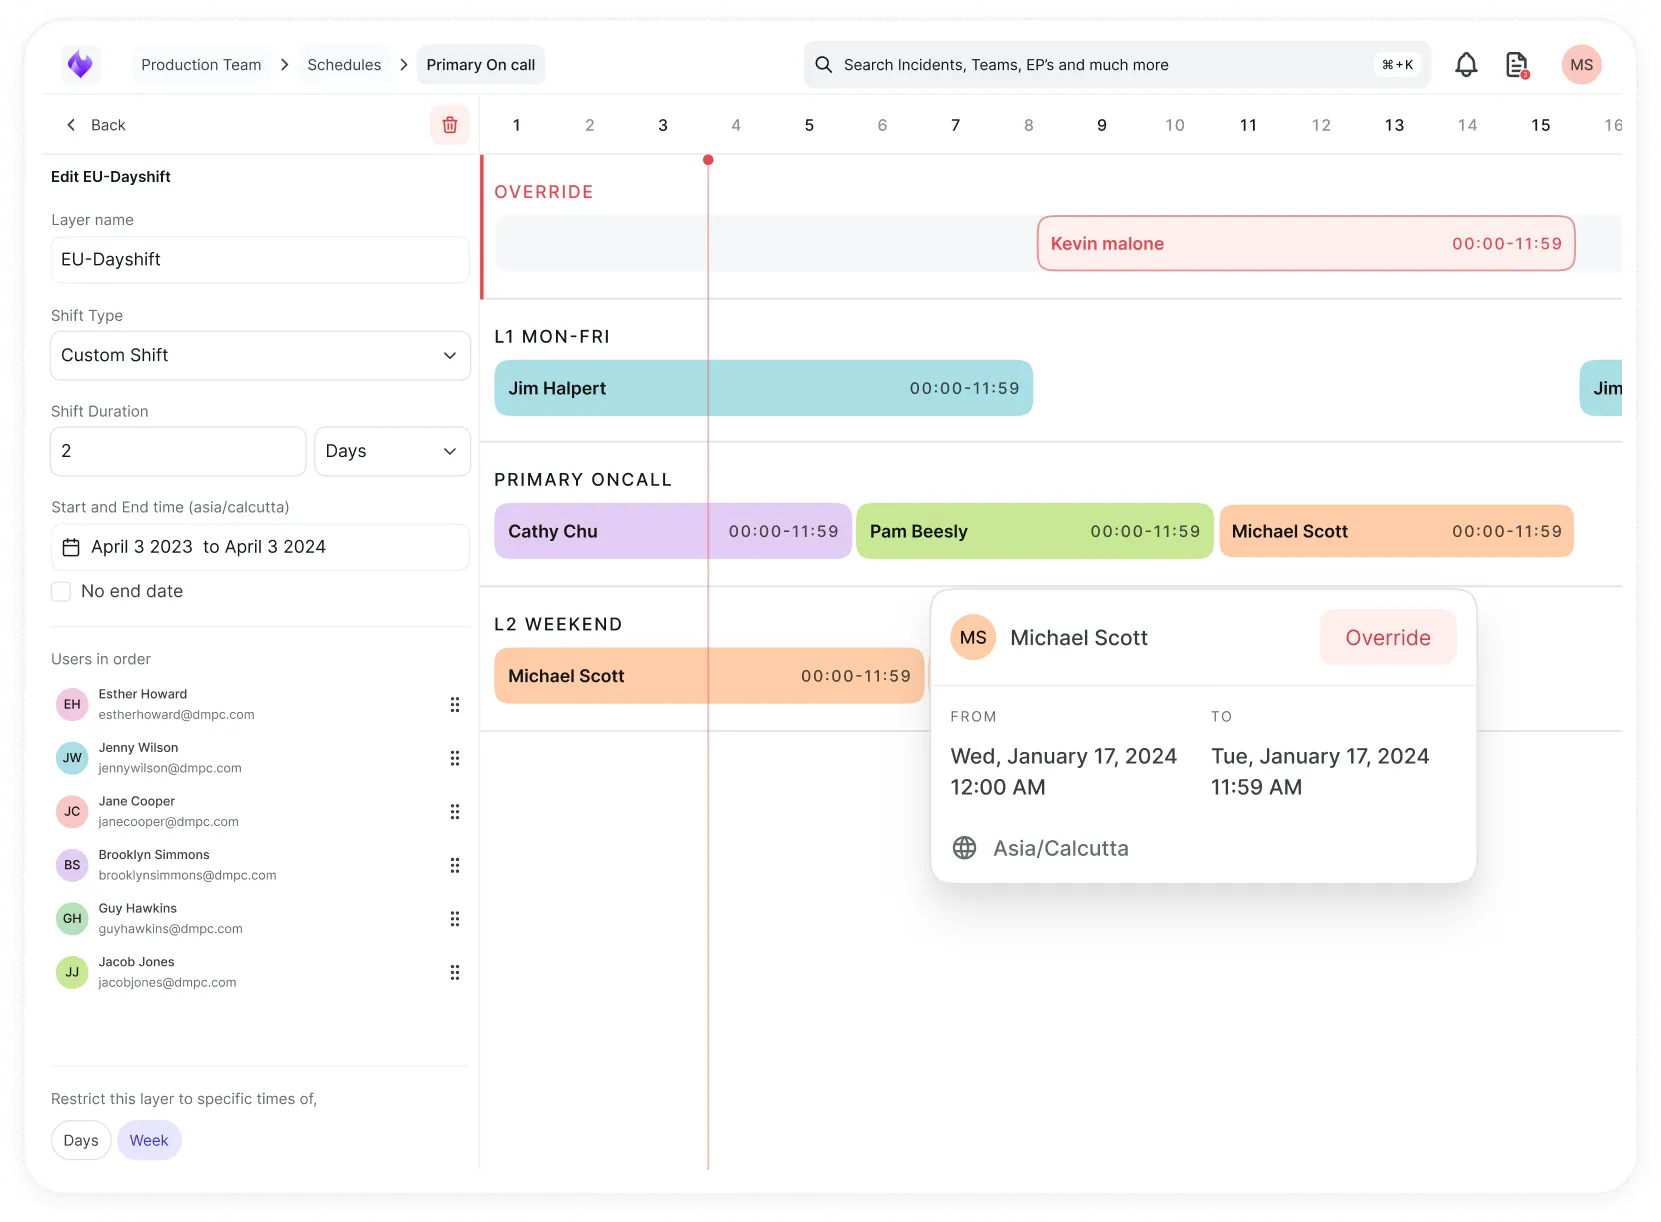
Simplify on-call scheduling, automate escalations, and reduce burnout.
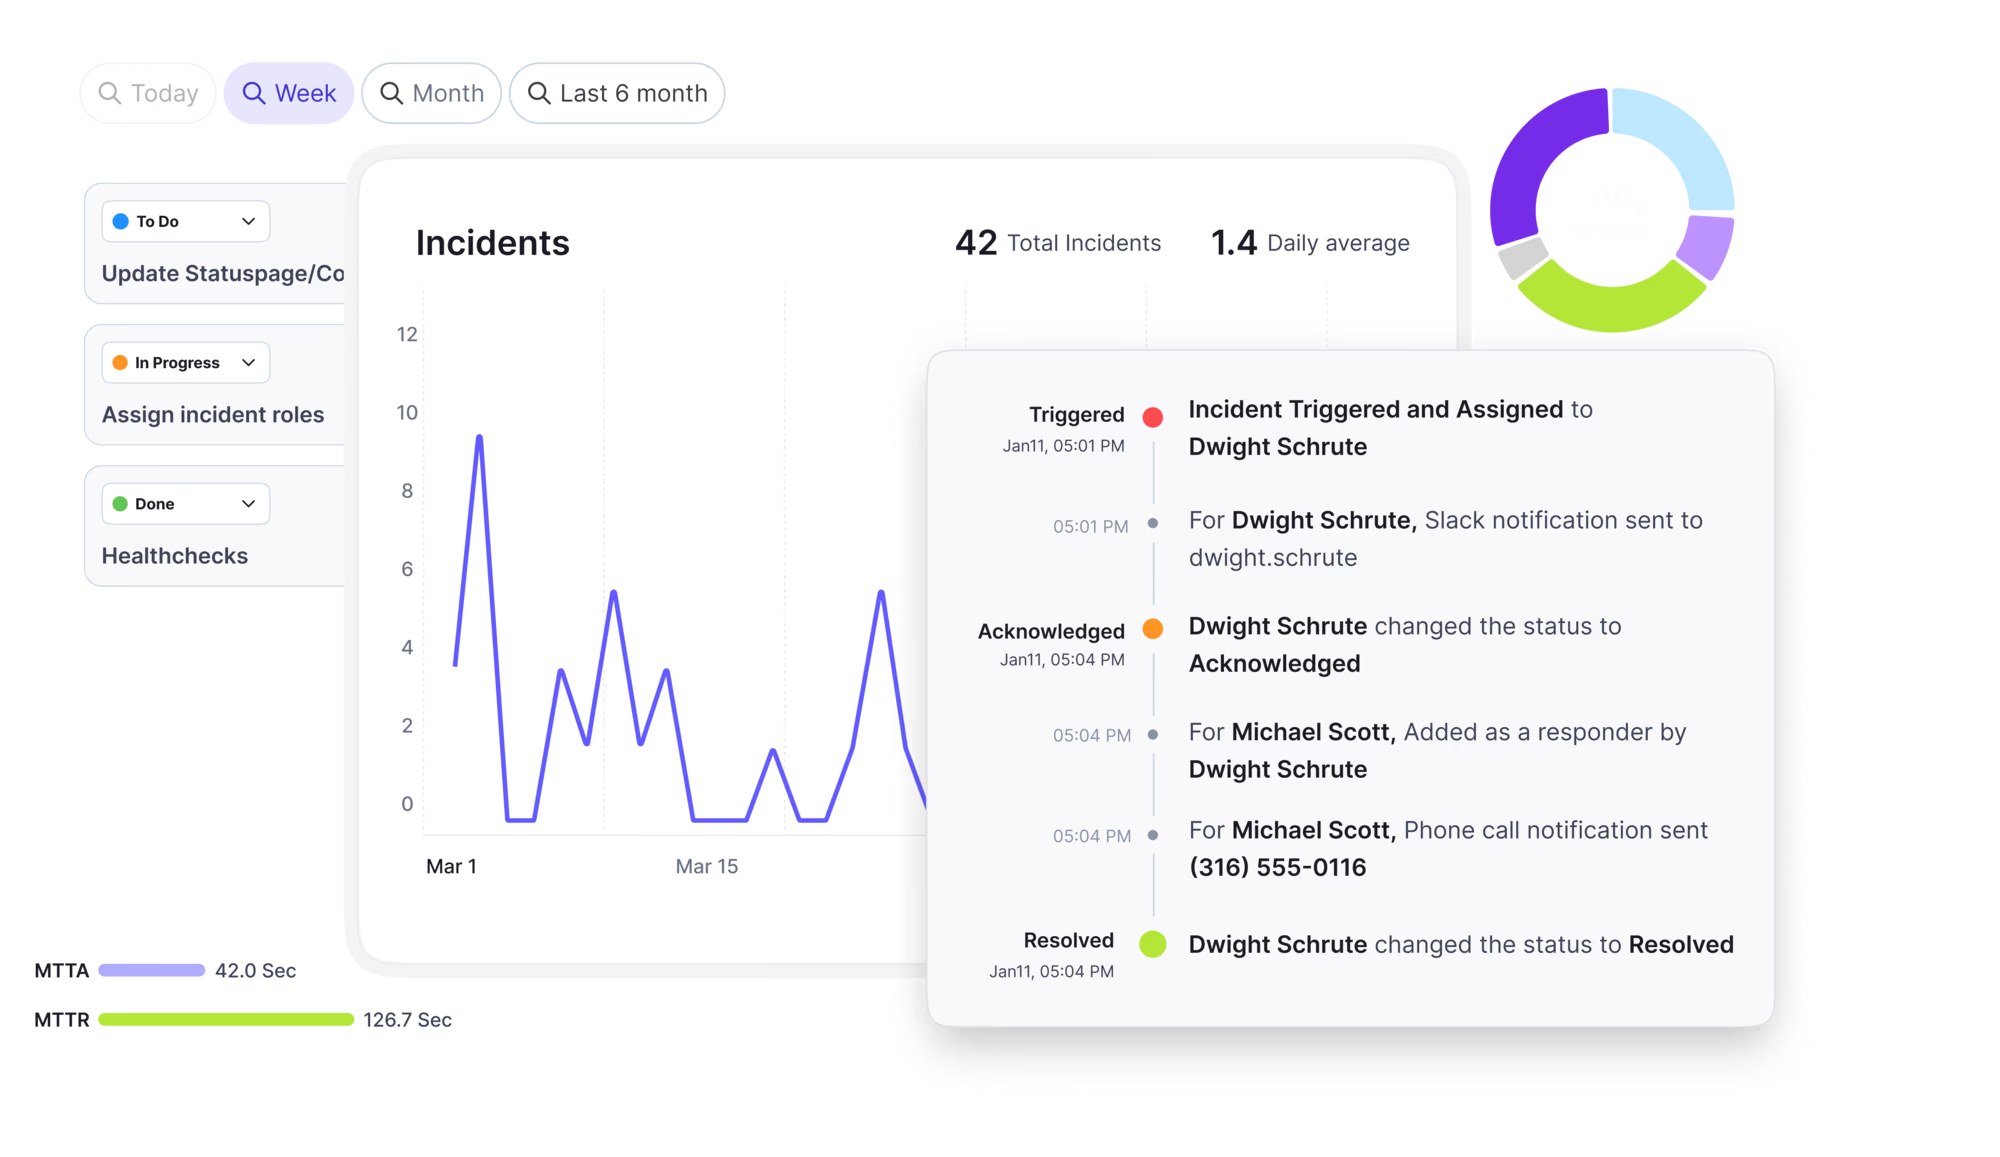
Automate postmortems, AI summaries, and post-incident workflows
Create, organize, and continuously improve your knowledge base to find the right answers with Sera AI.

We're here to help

The integration with Atlassian Jira using the Xurrent Integration Service is

The integration with Atlassian Jira using the Xurrent Integration Service is

The integration with Atlassian Jira using the Xurrent Integration Service is

The integration with Atlassian Jira using the Xurrent Integration Service is

The integration with Atlassian Jira using the Xurrent Integration Service is

The integration with Atlassian Jira using the Xurrent Integration Service is

The integration with Atlassian Jira using the Xurrent Integration Service is

The integration with Atlassian Jira using the Xurrent Integration Service is
Resolve issues quickly with an AI-powered system that automates ticketing.
Unifiy IT, HR, Facilities, Finance, and more on a single, AI-powered service platform.
Simplify on-call scheduling, automate escalations, and reduce burnout.
Automate postmortems, AI summaries, and post-incident workflows
Create, organize, and continuously improve your knowledge base to find the right answers with Sera AI.
Resolve plant floor and IT issues before they disrupt production.
Stay audit-ready while resolving issues and reducing operational risk.

Detect, respond, and resolve incidents fast to cut downtime and MTTR.

Keep your store online, even during your biggest sales moments.

Protect patient data and resolve issues fast, so care teams stay focused on care.

Standardize service delivery across every store and channel.

We are here to help 24/7

Connect with other Xurrent Users

Get insights and tips on how to get the most out of Xurrent

Apps, APIs, and updates

Xurrent service functionality

Eliminate manual tasks, optimize workflows, and deliver faster resolutions.
Learn how organizations have reduced downtime, improved 50% MTTA & MTTR, and cut costs with Xurrent IMR.
Discover Xurrent IMR's quick support, bidirectional integrations with Jira and Slack, and more cohesive incident response capabilities compared to Opsgenie.
Understand why users value Xurrent IMR for its intuitive interface, efficient incident alerting, customizable On-call schedules, and escalations.

In the following example, we will be creating a histogram in Grafana. Our datasource is Prometheus’s cumulative histogram.
I have captured the metrics using micrometer’s distribution summary. I have 12 buckets for report size. I want to show size buckets on X axis and its count on Y-axis. e.g: 20 Kb - 100 Kb : 100 100 Kb -500 Kb : 500 500 Kb -1 Mb : 1000 1 Mb - 10 Mb : 15
rptsize_megabyte_bucket{le="1.0",} 5.0 rptsize_megabyte_bucket{le="5.0",} 8.0 rptsize_megabyte_bucket{le="10.0",} 10.0 rptsize_megabyte_bucket{le="50.0",} 15.0 rptsize_megabyte_bucket{le="100.0",} 16.0 rptsize_megabyte_bucket{le="300.0",} 16.0 rptsize_megabyte_bucket{le="500.0",} 16.0 rptsize_megabyte_bucket{le="1000.0",} 16.0 rptsize_megabyte_bucket{le="2000.0",} 16.0 rptsize_megabyte_bucket{le="3000.0",} 16.0 rptsize_megabyte_bucket{le="5000.0",} 16.0 rptsize_megabyte_bucket{le="+Inf",} 16.0 rptsize_megabyte_count 16.0 rptsize_megabyte_sum 239.8
Create a bar gauge graph, set Format in the query tab to Heatmap and query
sum(vmrs_rptsize_megabyte_bucket
) by (le)
In the panel option’s Display tab you’ll probably want to set Value to Last instead of Mean.
Grafana is aware of Prometheus’ cumulative buckets, so when you change format Time series to format Heatmap it’ll deduplicate the result and places the buckets in order.
There are three steps:
Check out Björn “Beorn” Rabenstein’s on Prometheus’s rate queries
Sign up for a 14-day free trial of Xurrent IMR. No CC required. Implement modern incident response and SRE best practices within your production operations and provide industry-leading SLAs to your customers.
Most AI SREs are pattern matchers trained on public data. They know what a memory leak looks like in the abstract. They don't know that your payments-api has a flaky liveness probe everyone ignores, that the checkout team owns the retry policy, or that the last three "database incidents" were actually cache misconfigurations. That knowledge lives in your postmortems, your Slack channels, and the heads of two senior engineers.
Most vendors will tell you ITSM implementation takes six months to a year — but modern, configuration-first platforms have rewritten the math entirely. See what real implementations look like in 2026, and why a long rollout is now a choice, not a given.



.webp)
.webp)