




Blog
Insights & updates from our experts


Resolve plant floor and IT issues before they disrupt production.

Stay audit-ready while resolving issues and reducing operational risk.
Resolve issues quickly with an AI-powered system that automates ticketing.
Unifiy IT, HR, Facilities, Finance, and more on a single, AI-powered service platform.
Simplify on-call scheduling, automate escalations, and reduce burnout.
Automate postmortems, AI summaries, and post-incident workflows
Create, organize, and continuously improve your knowledge base to find the right answers with Sera AI.
We're here to help

The integration with Atlassian Jira using the Xurrent Integration Service is

The integration with Atlassian Jira using the Xurrent Integration Service is

The integration with Atlassian Jira using the Xurrent Integration Service is

The integration with Atlassian Jira using the Xurrent Integration Service is

The integration with Atlassian Jira using the Xurrent Integration Service is

The integration with Atlassian Jira using the Xurrent Integration Service is

The integration with Atlassian Jira using the Xurrent Integration Service is

The integration with Atlassian Jira using the Xurrent Integration Service is
Resolve issues quickly with an AI-powered system that automates ticketing.
Unifiy IT, HR, Facilities, Finance, and more on a single, AI-powered service platform.
Simplify on-call scheduling, automate escalations, and reduce burnout.
Automate postmortems, AI summaries, and post-incident workflows
Create, organize, and continuously improve your knowledge base to find the right answers with Sera AI.
Resolve plant floor and IT issues before they disrupt production.
Stay audit-ready while resolving issues and reducing operational risk.

Detect, respond, and resolve incidents fast to cut downtime and MTTR.

Keep your store online, even during your biggest sales moments.

Protect patient data and resolve issues fast, so care teams stay focused on care.

Standardize service delivery across every store and channel.

We are here to help 24/7

Connect with other Xurrent Users

Get insights and tips on how to get the most out of Xurrent

Apps, APIs, and updates

Xurrent service functionality

Eliminate manual tasks, optimize workflows, and deliver faster resolutions.
Learn how organizations have reduced downtime, improved 50% MTTA & MTTR, and cut costs with Xurrent IMR.
Discover Xurrent IMR's quick support, bidirectional integrations with Jira and Slack, and more cohesive incident response capabilities compared to Opsgenie.
Understand why users value Xurrent IMR for its intuitive interface, efficient incident alerting, customizable On-call schedules, and escalations.

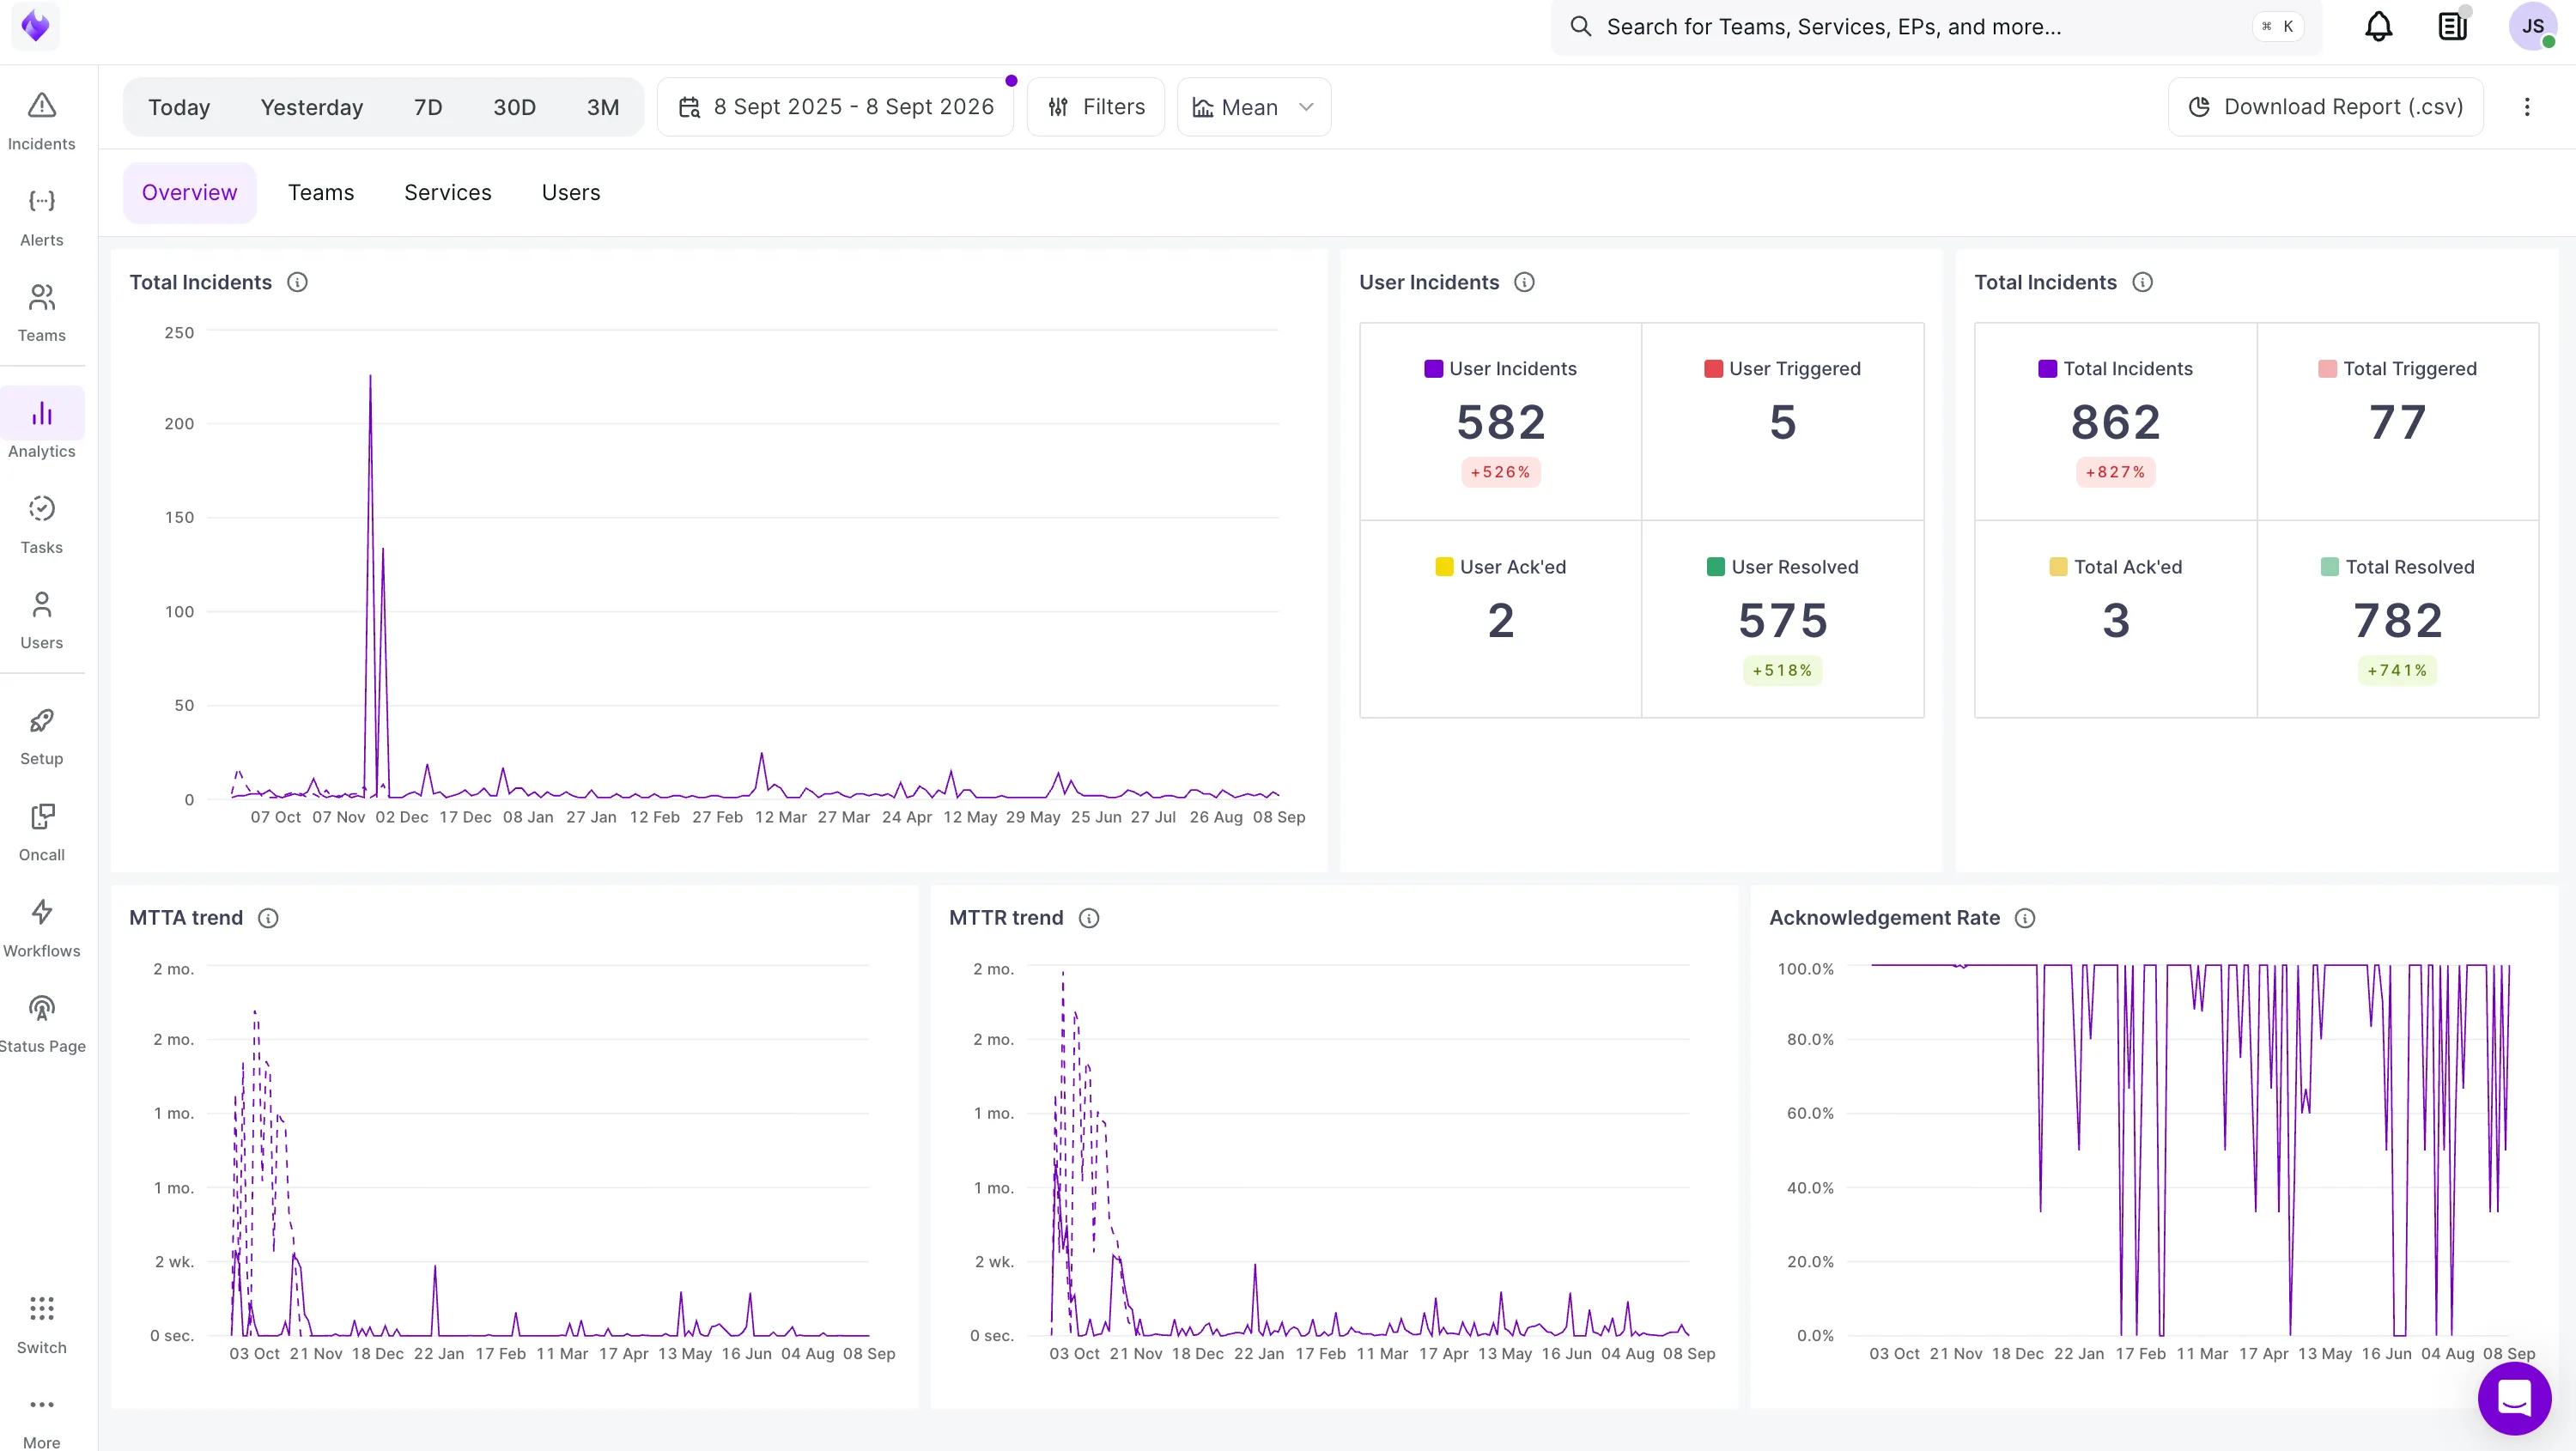
Xurrent IMR has an inbuilt analytics dashboard. It gives you insight into performance by account, teams, services or users. You can select custom date ranges and filters to track activity for every segment.
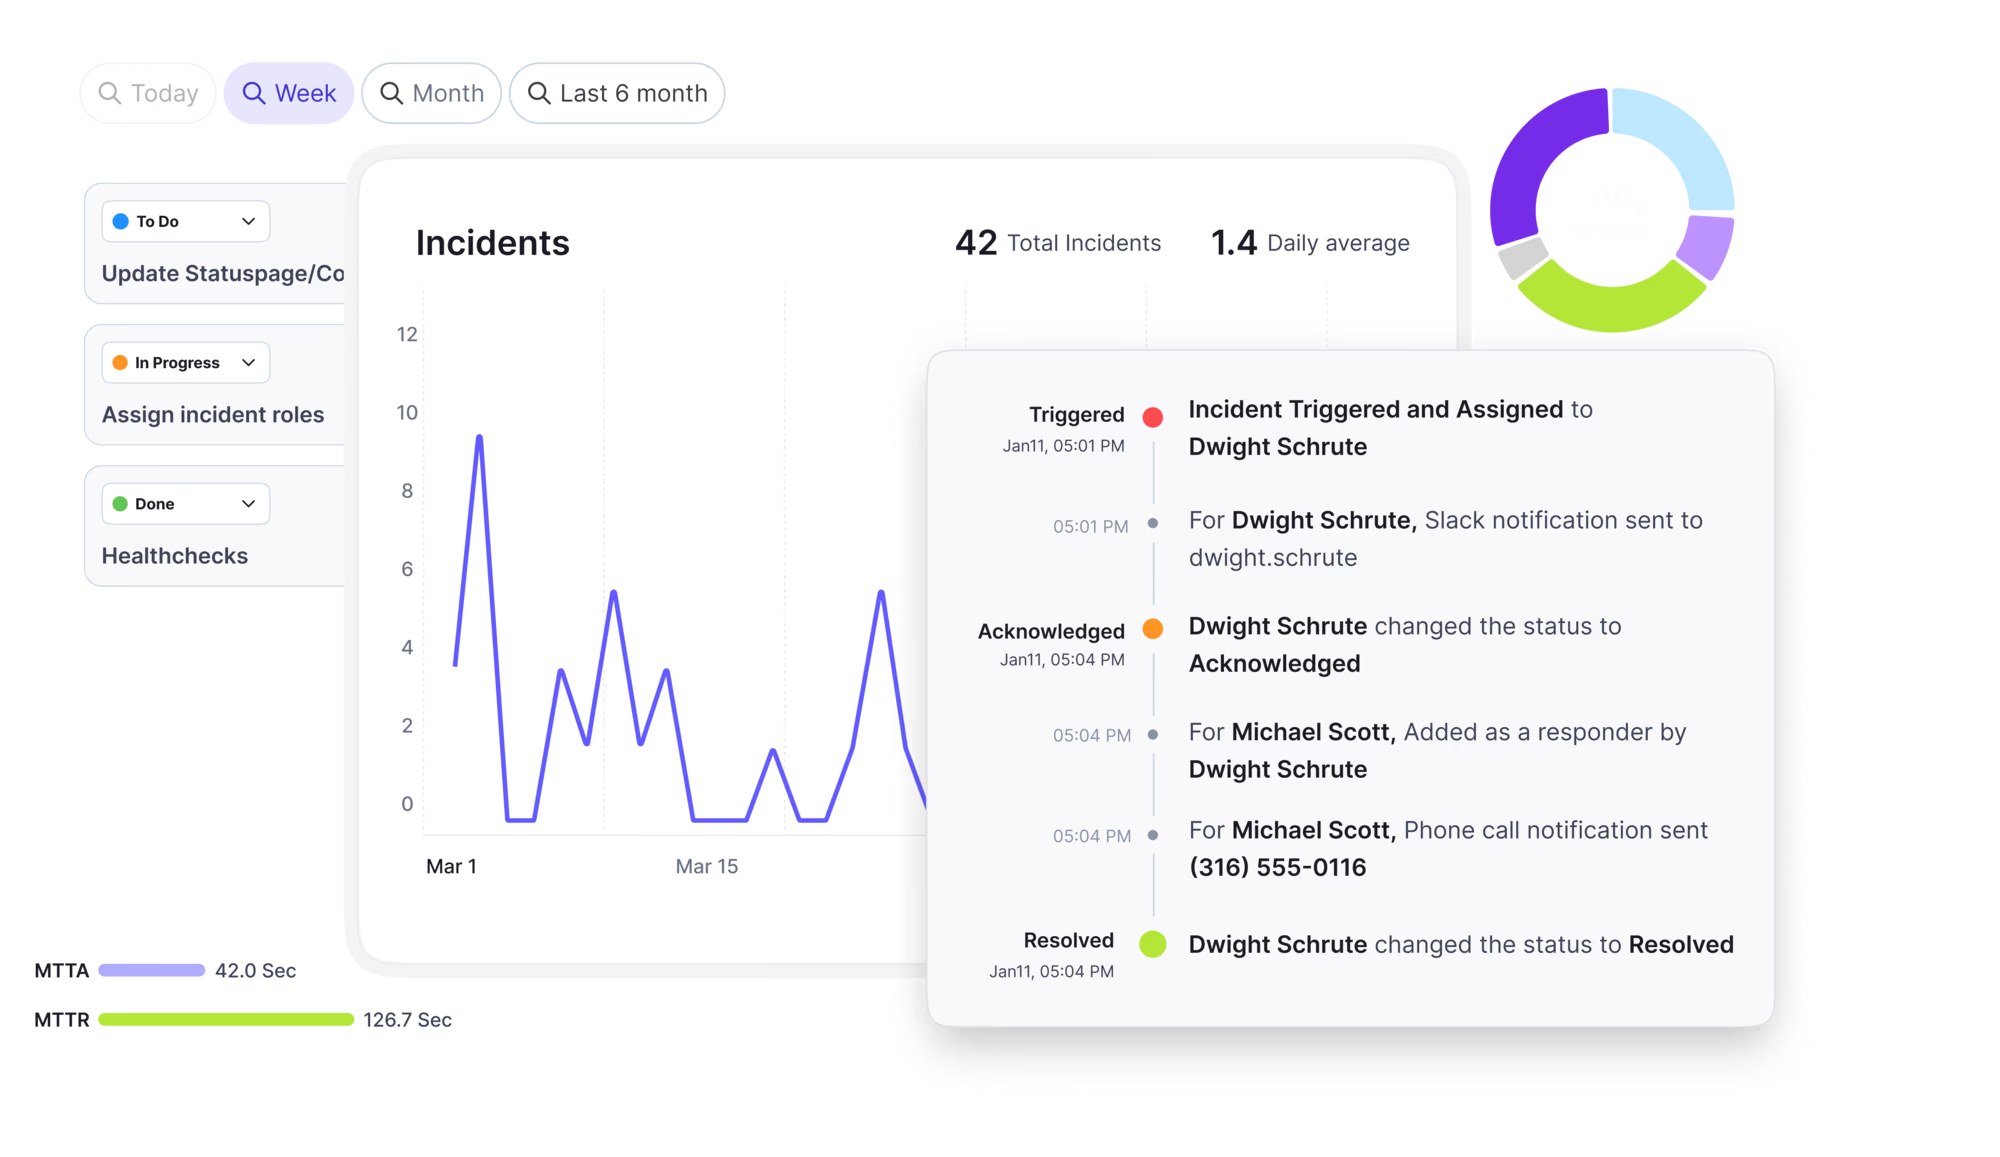
Analytics gives you the count of Total Incidents, MTTA (Mean Time To Acknowledge) and MTTR (Mean Time To Resolve) over the time frame you select. Each metric can be shown as a mean or as a percentile, and any view can be exported to CSV.
Select Analytics in the left navigation, then choose a tab. All four views share the same date range, filters, aggregation, and export controls.
Account-wide totals and trends. Shows Total Incidents over time, breakdowns of triggered, acknowledged, and resolved incidents at both user and account level, and trend charts for MTTA, MTTR, and acknowledgement rate.
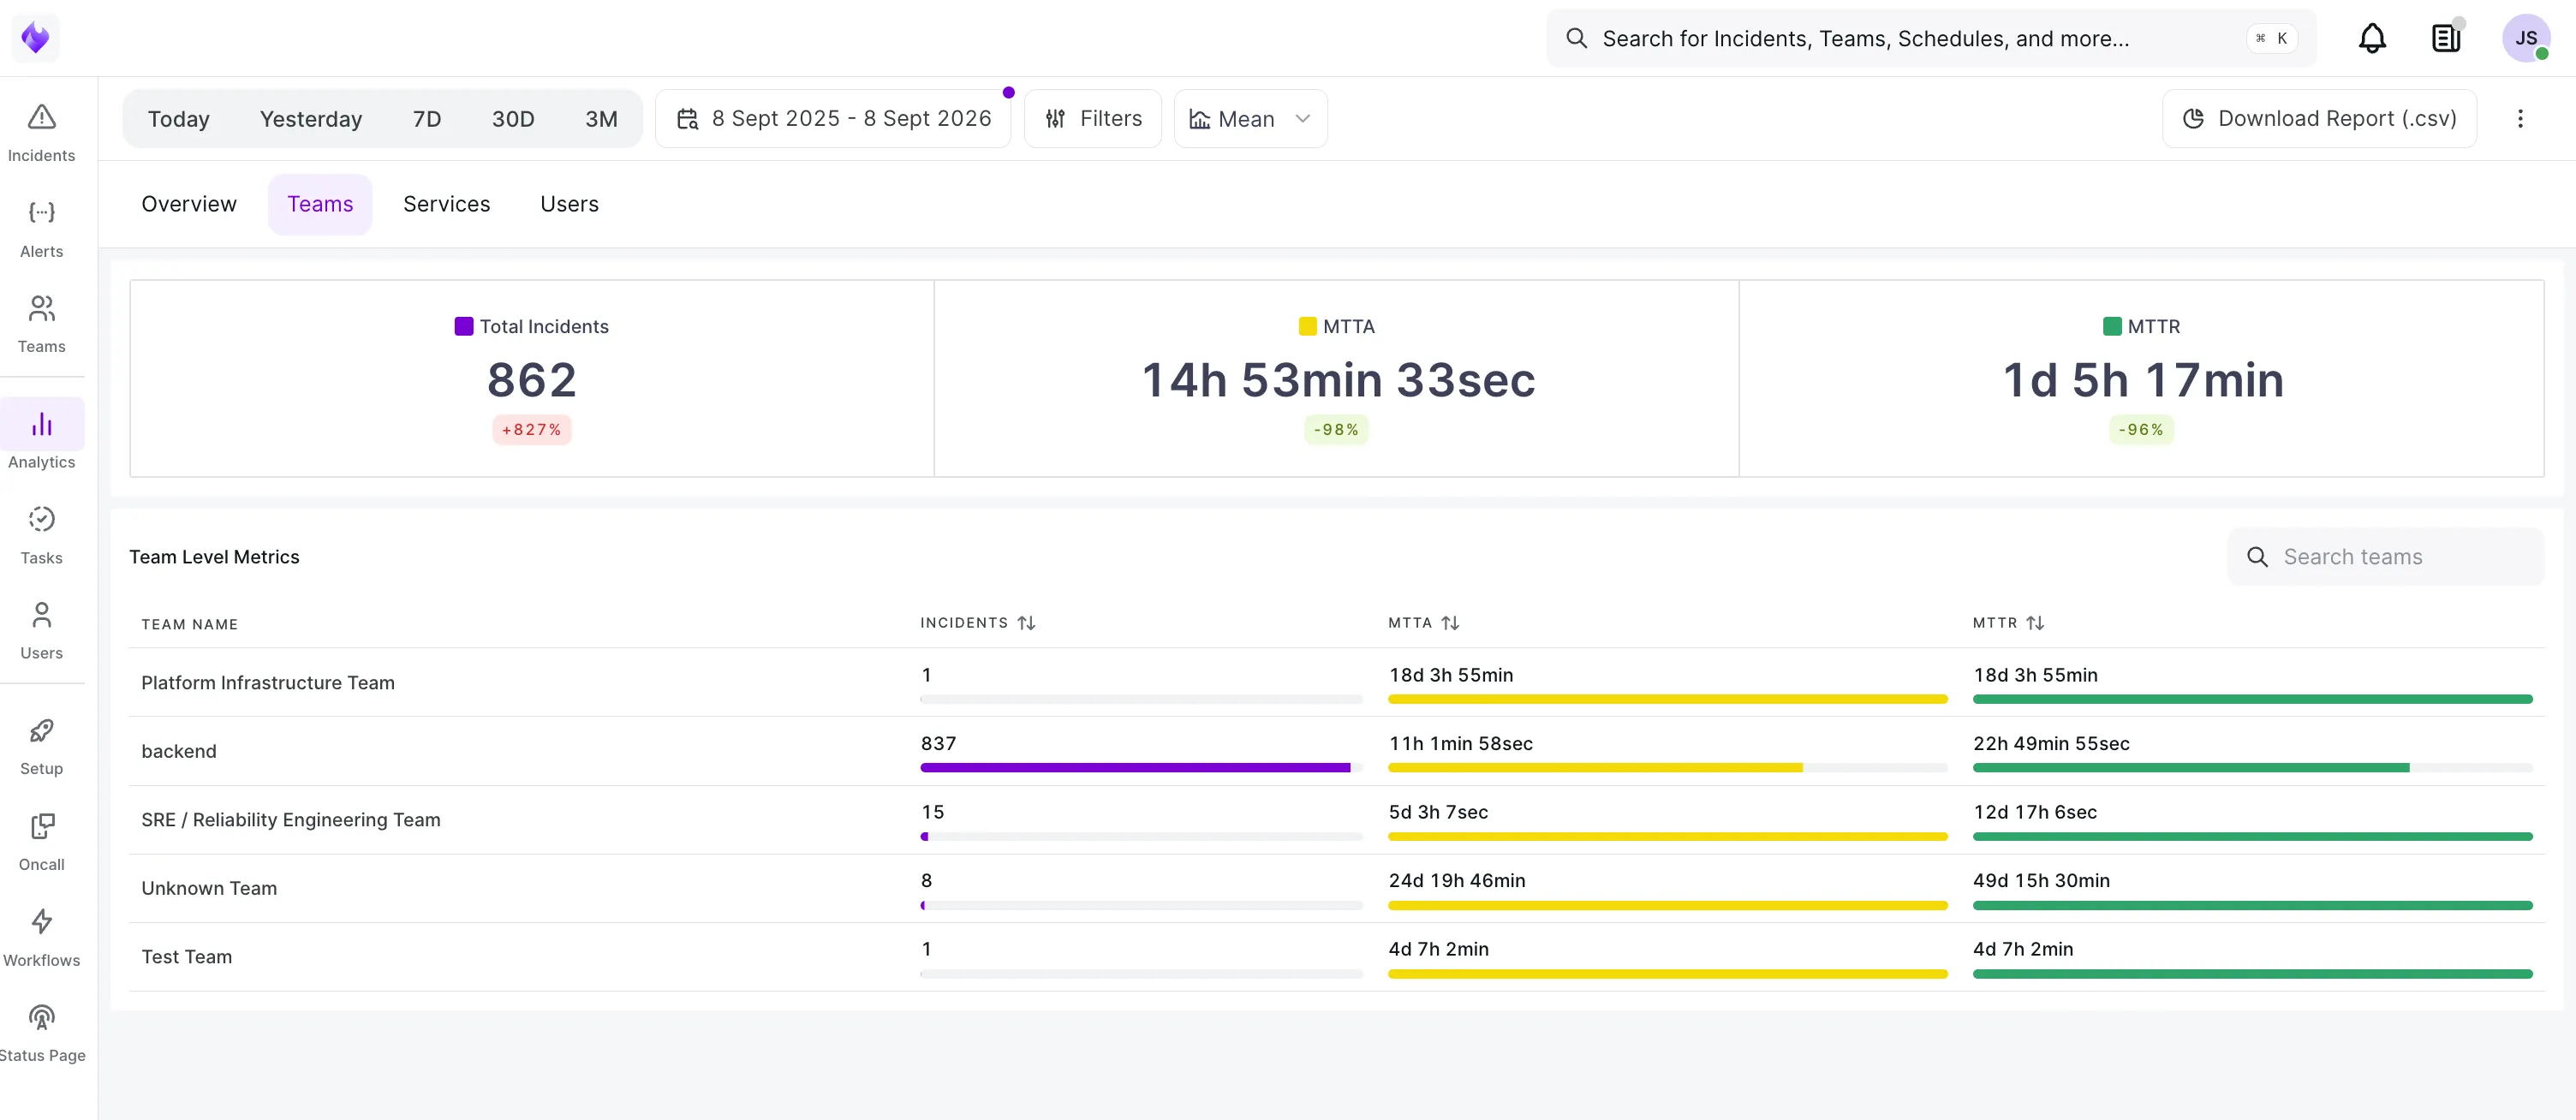
Team Level Metrics: incidents, MTTA, and MTTR for every team, with account totals above. Sort by any column to find the team carrying the most volume or the slowest resolution.
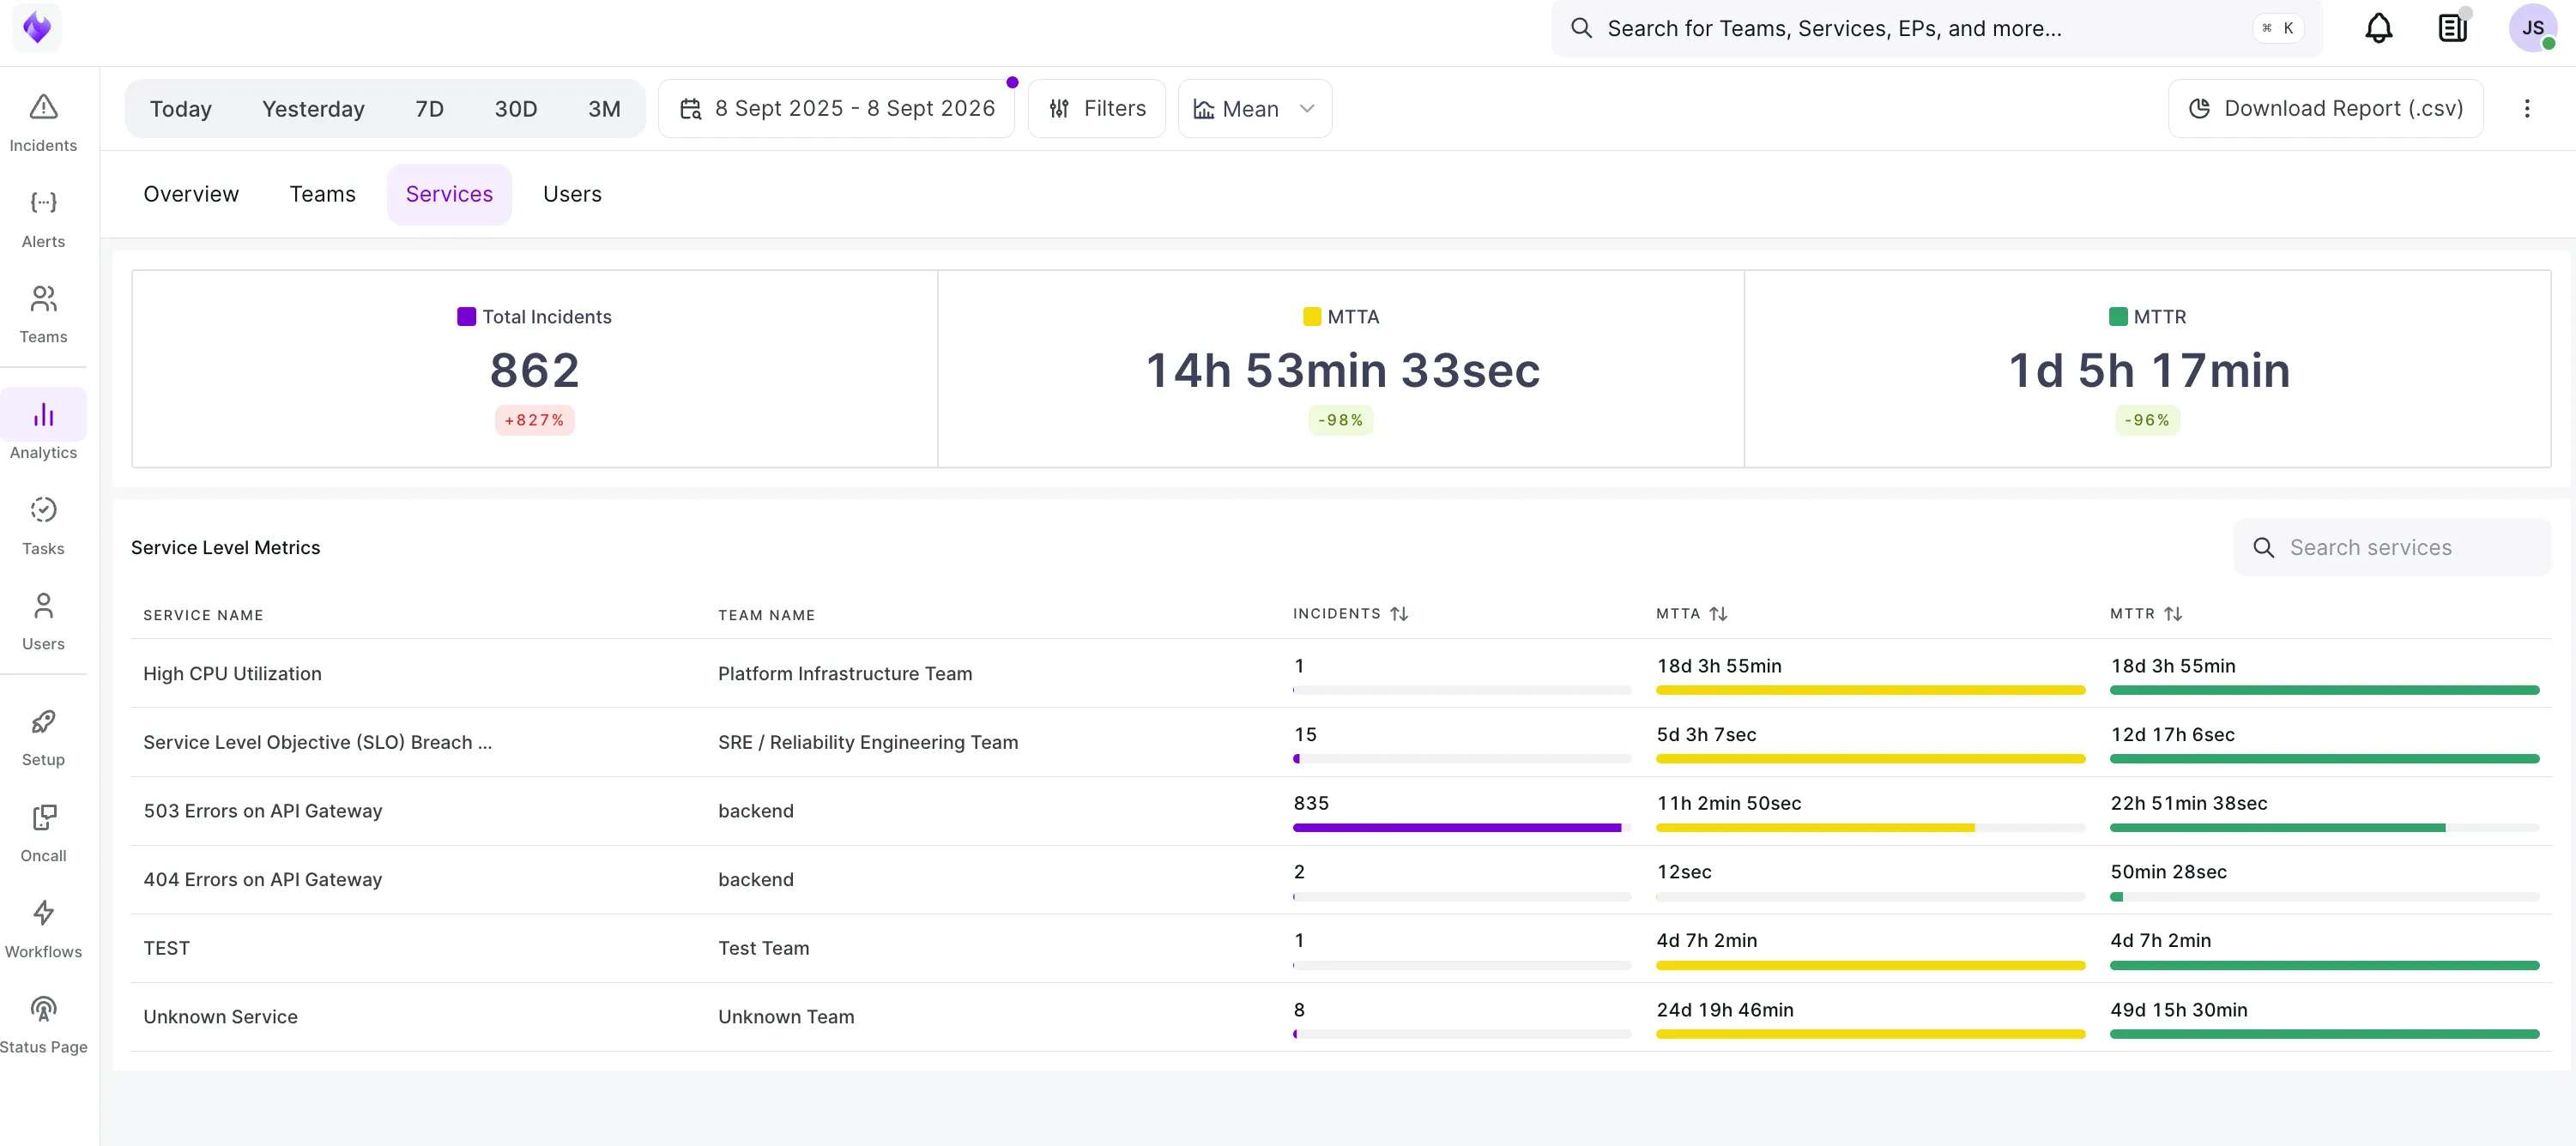
Service Level Metrics: the same figures per service, with the owning team alongside. Use it to see which services generate the most incidents and where resolution takes longest.
The Users tab lists incidents, calls, MTTA, and MTTR for each person under User Level Metrics, with unassigned incidents grouped under Unassigned User. Sort by any column to compare individuals, and use Load More to extend the list.
The Calls column counts every phone call in the escalation chain, not only calls to the person who acknowledged. Call data is available from 15 August 2026 onwards; earlier date ranges under-report calls.
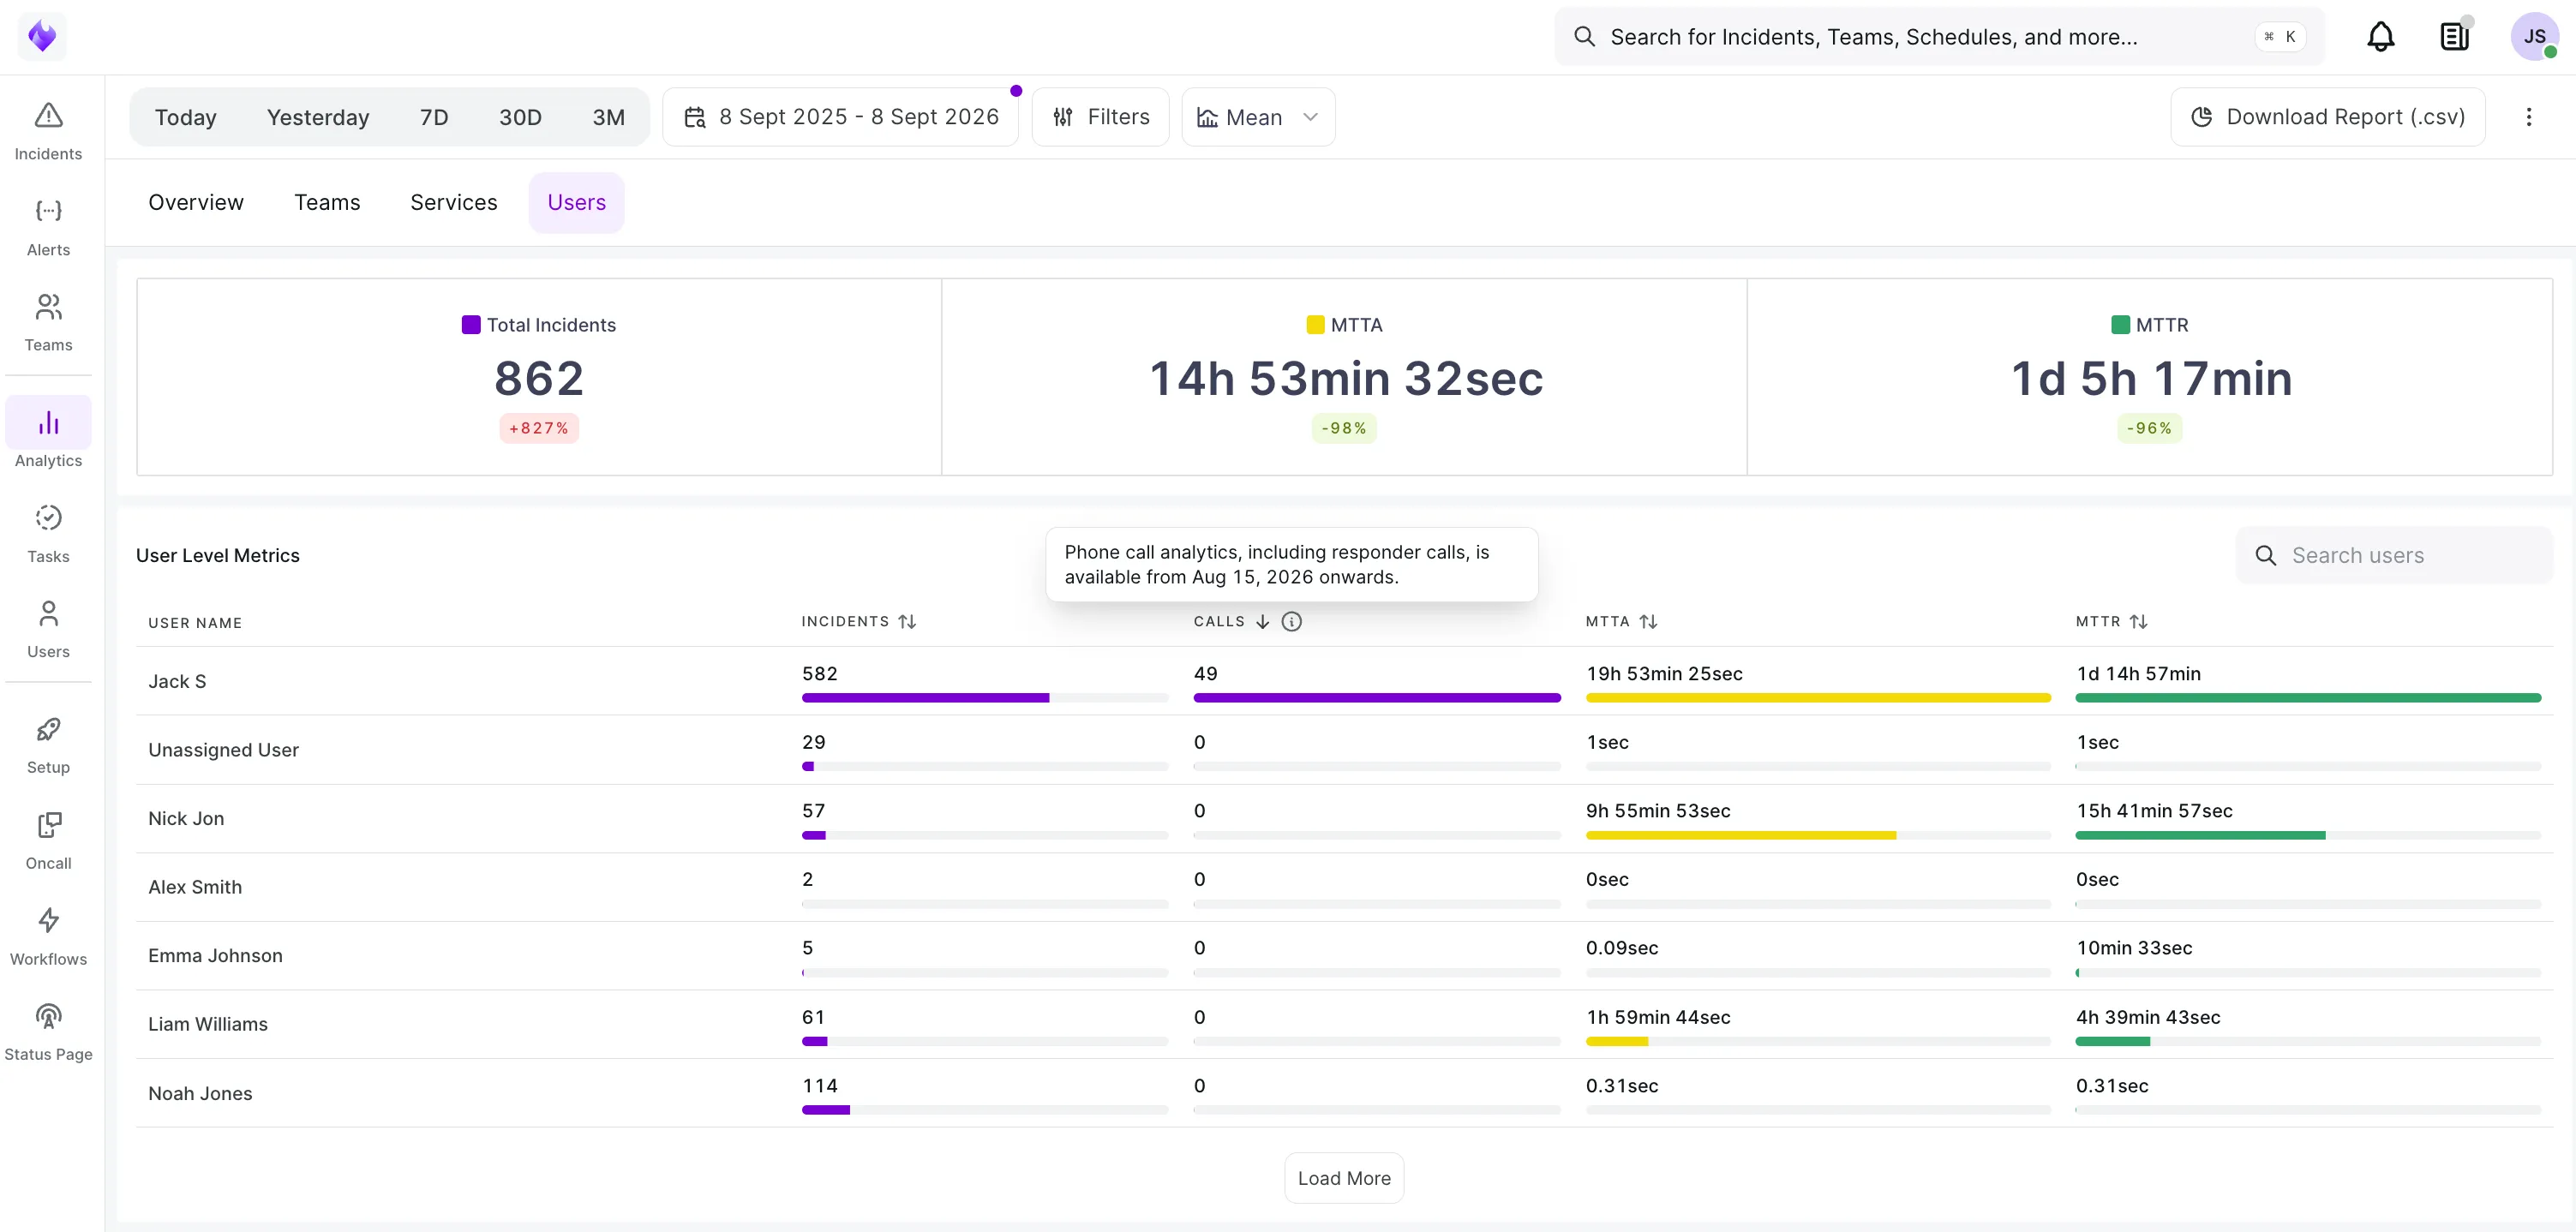
The Teams, Services, and Users views each have a search box, and every table sorts by any column.
Set the time range
Comparison percentages are relative to the previous period of the same length, so short ranges produce volatile comparisons.
Filter the data
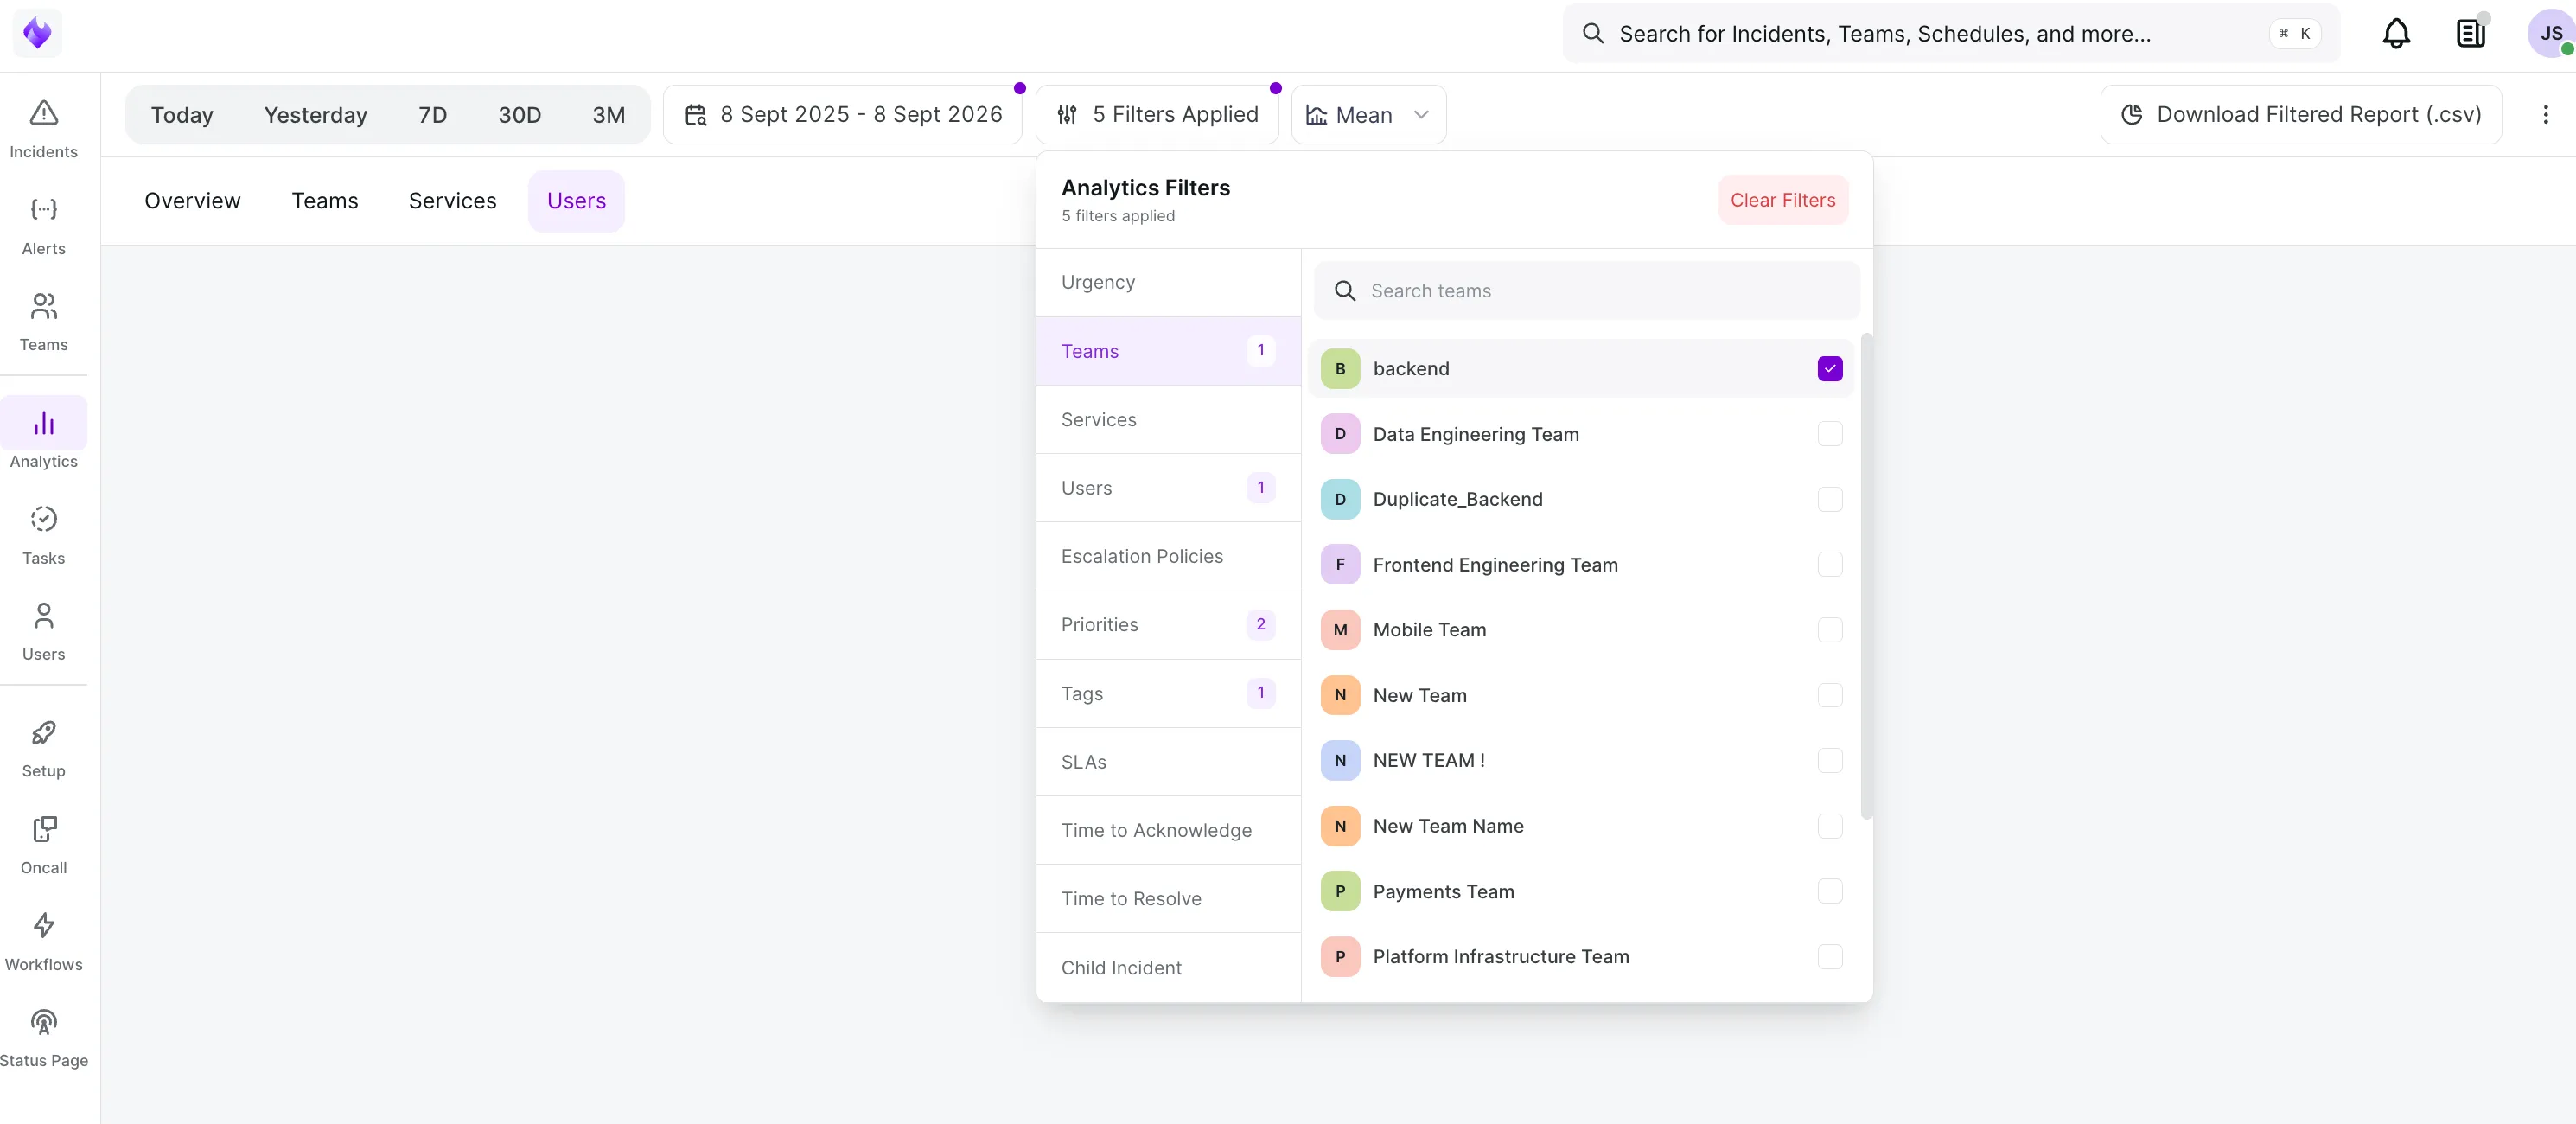
Export a report
The setting applies to Total Incidents, MTTA, and MTTR across all four views.
P95 MTTR is the resolution time that 95% of incidents fall at or below. Percentiles describe the tail of the distribution rather than its centre, which is often closer to what responders experienced.
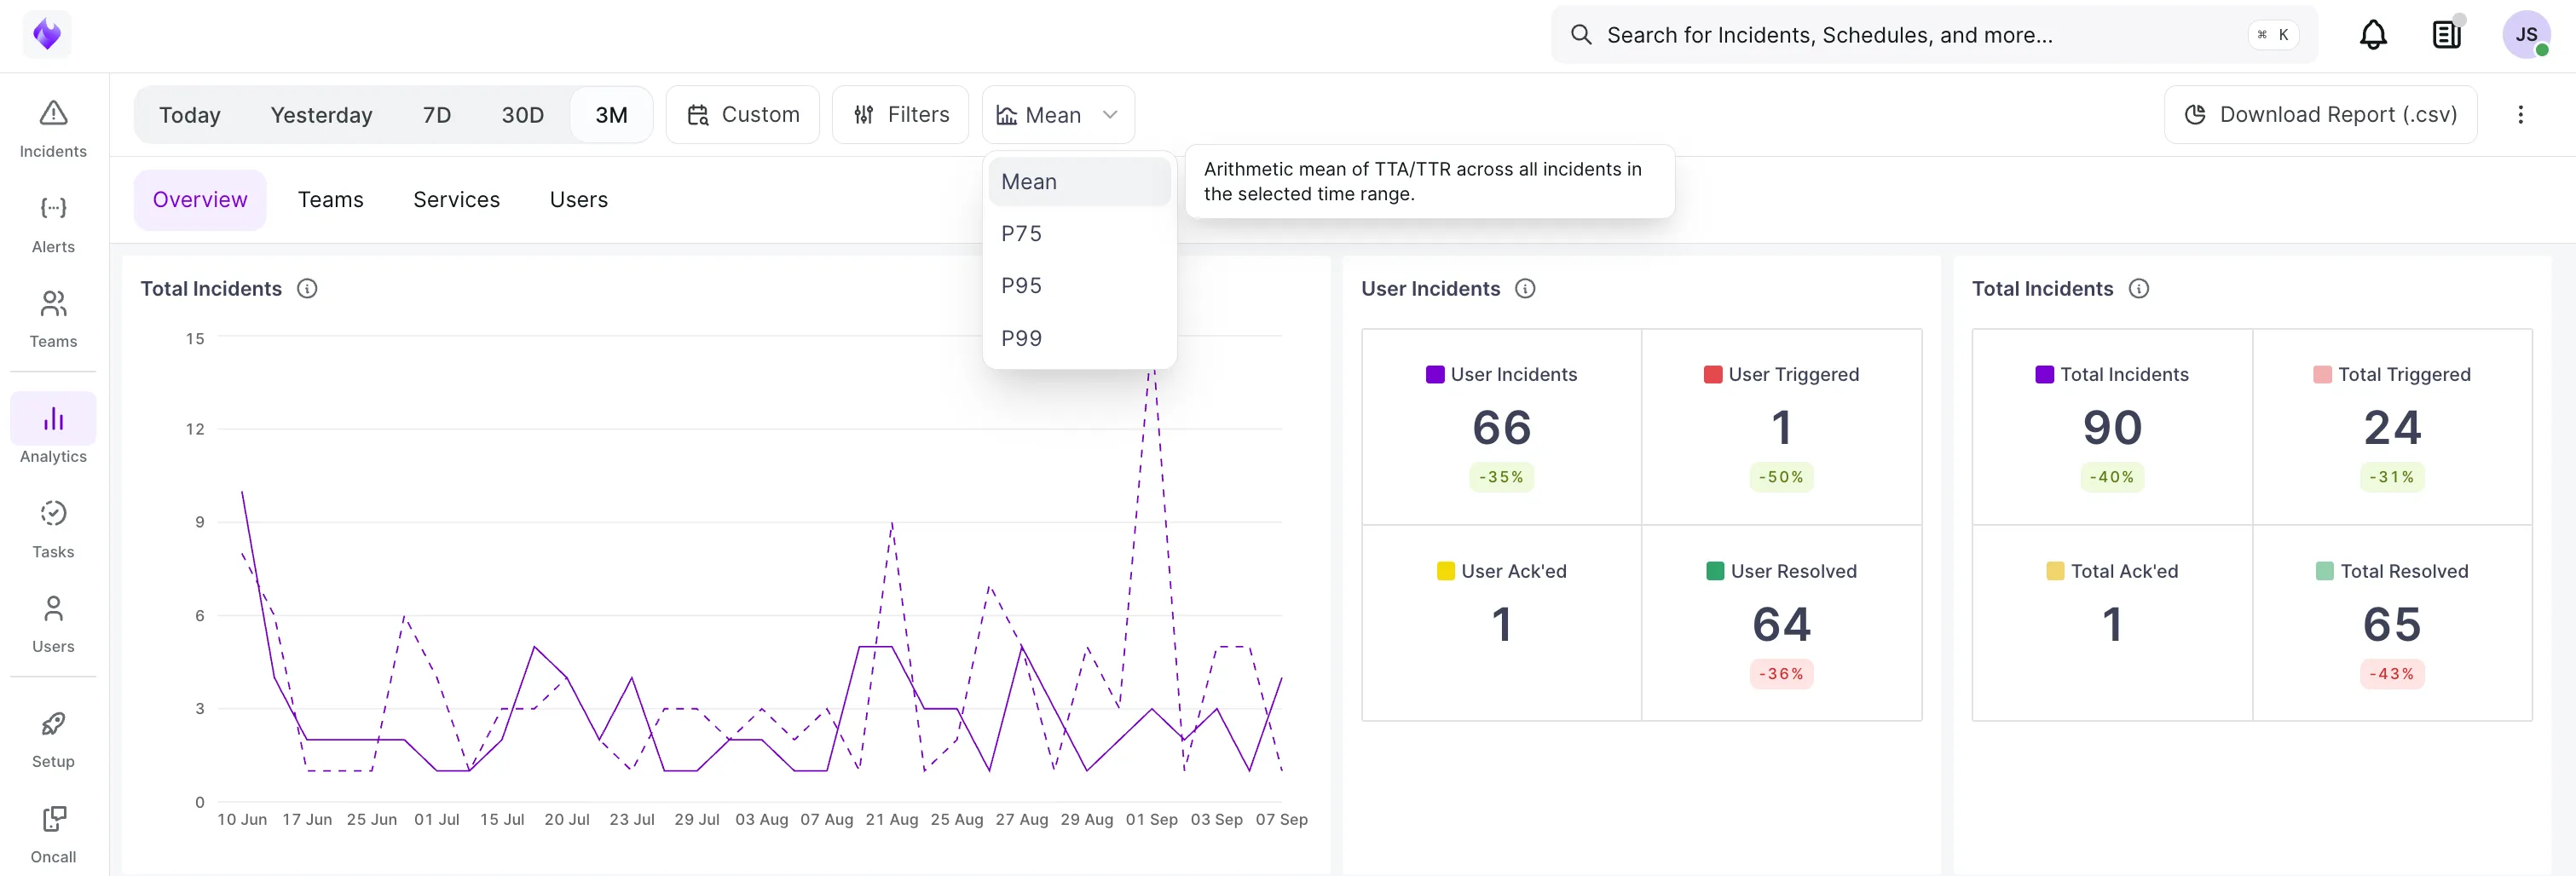
Tip: Report a percentile alongside the mean rather than instead of it. A mean of four hours with a P95 of three days describes the workload more accurately than either figure alone.
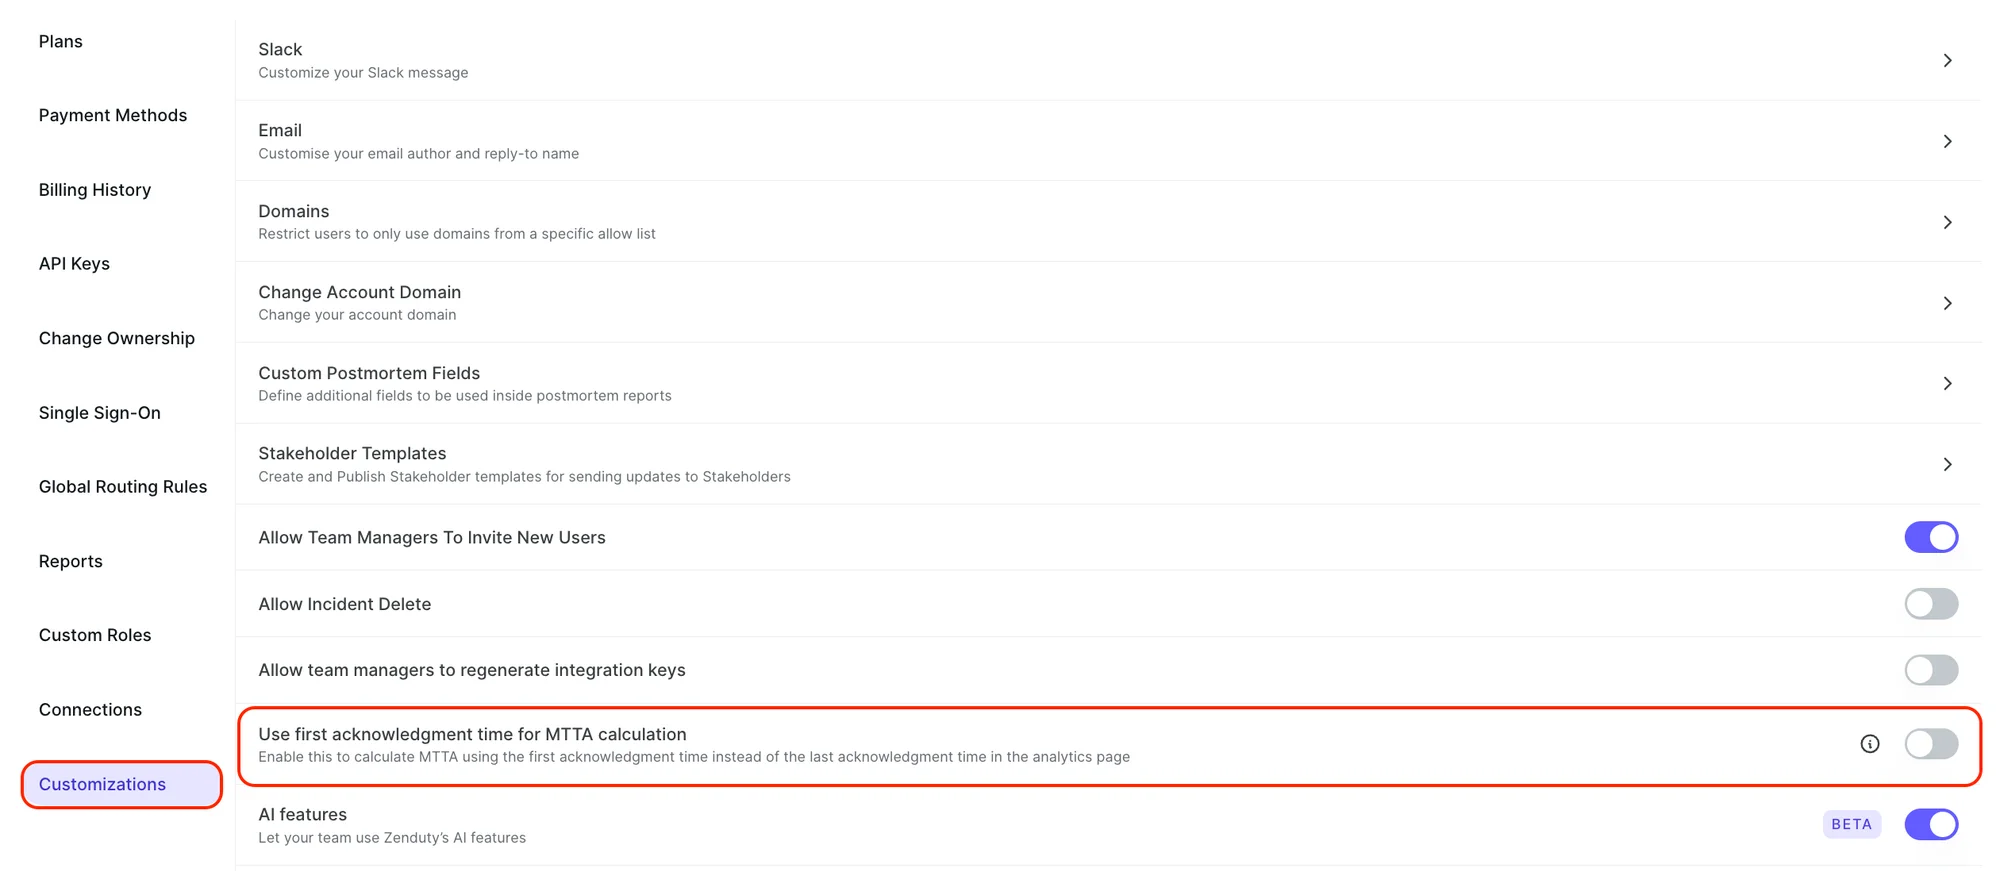
By default, MTTA uses the last acknowledgement recorded on an incident. It can instead use the first acknowledgement by any responder.
For an incident triggered at 10:00 and first acknowledged at 10:03, the first acknowledgement time is 10:03, regardless of who acknowledges afterwards.



.webp)
.webp)