.webp)


Blog
Insights & updates from our experts
Resolve issues quickly with an AI-powered system that automates ticketing.

Resolve issues quickly with an AI-powered system that automates ticketing.

Resolve issues quickly with an AI-powered system that automates ticketing.

Resolve issues quickly with an AI-powered system that automates ticketing.
Resolve issues quickly with an AI-powered system that automates ticketing.

Resolve issues quickly with an AI-powered system that automates ticketing.

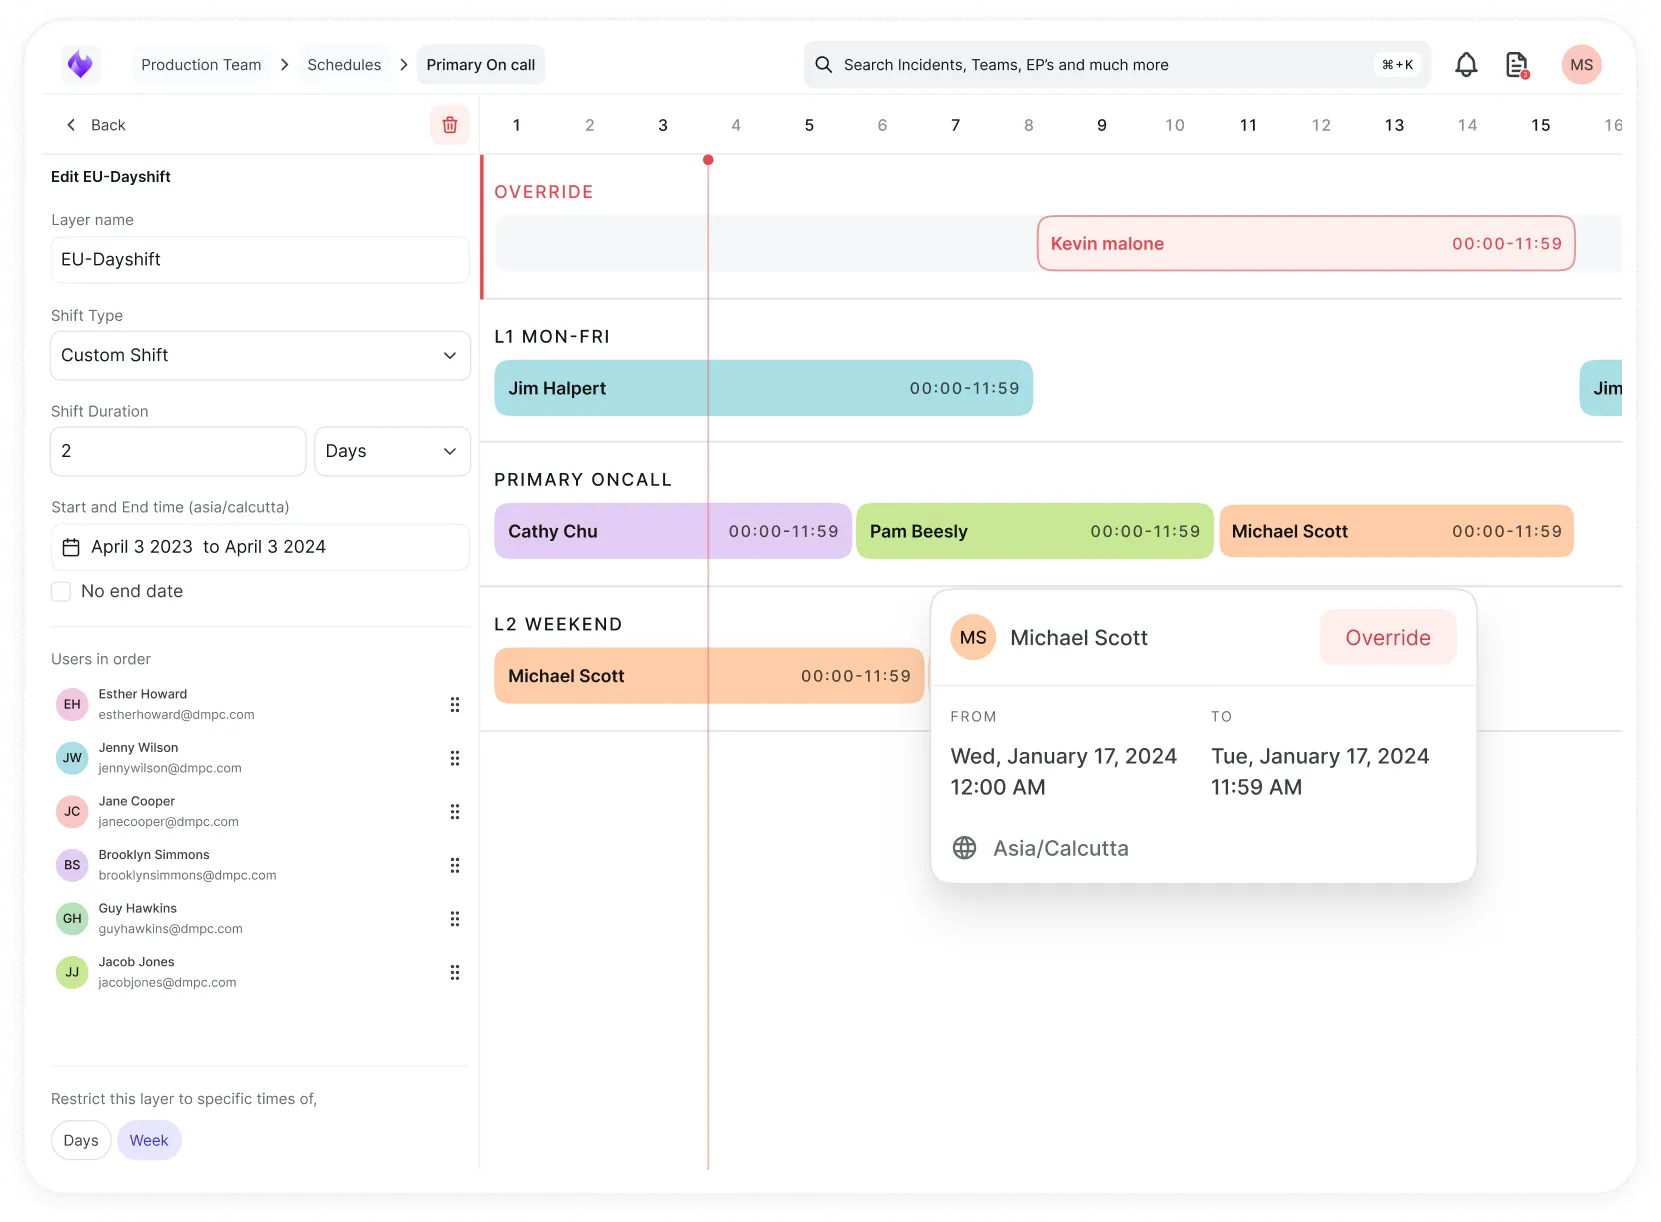
Simplify on-call scheduling, automate escalations, and reduce burnout.
Automate postmortems, AI summaries, and post-incident workflows
We're here to help

The integration with Atlassian Jira using the Xurrent Integration Service is

The integration with Atlassian Jira using the Xurrent Integration Service is

The integration with Atlassian Jira using the Xurrent Integration Service is

The integration with Atlassian Jira using the Xurrent Integration Service is

The integration with Atlassian Jira using the Xurrent Integration Service is

The integration with Atlassian Jira using the Xurrent Integration Service is

The integration with Atlassian Jira using the Xurrent Integration Service is

The integration with Atlassian Jira using the Xurrent Integration Service is
Resolve issues quickly with an AI-powered system that automates ticketing.
Resolve issues quickly with an AI-powered system that automates ticketing.
Simplify on-call scheduling, automate escalations, and reduce burnout.
Automate postmortems, AI summaries, and post-incident workflows
Resolve issues quickly with an AI-powered system that automates ticketing.
Resolve issues quickly with an AI-powered system that automates ticketing.
Resolve issues quickly with an AI-powered system that automates ticketing.
Resolve issues quickly with an AI-powered system that automates ticketing.

We are here to help 24/7

Connect with other Xurrent Users

Get insights and tips on how to get the most out of Xurrent

Apps, APIs, and updates

Xurrent service functionality
Eliminate manual tasks, optimize workflows, and deliver faster resolutions.
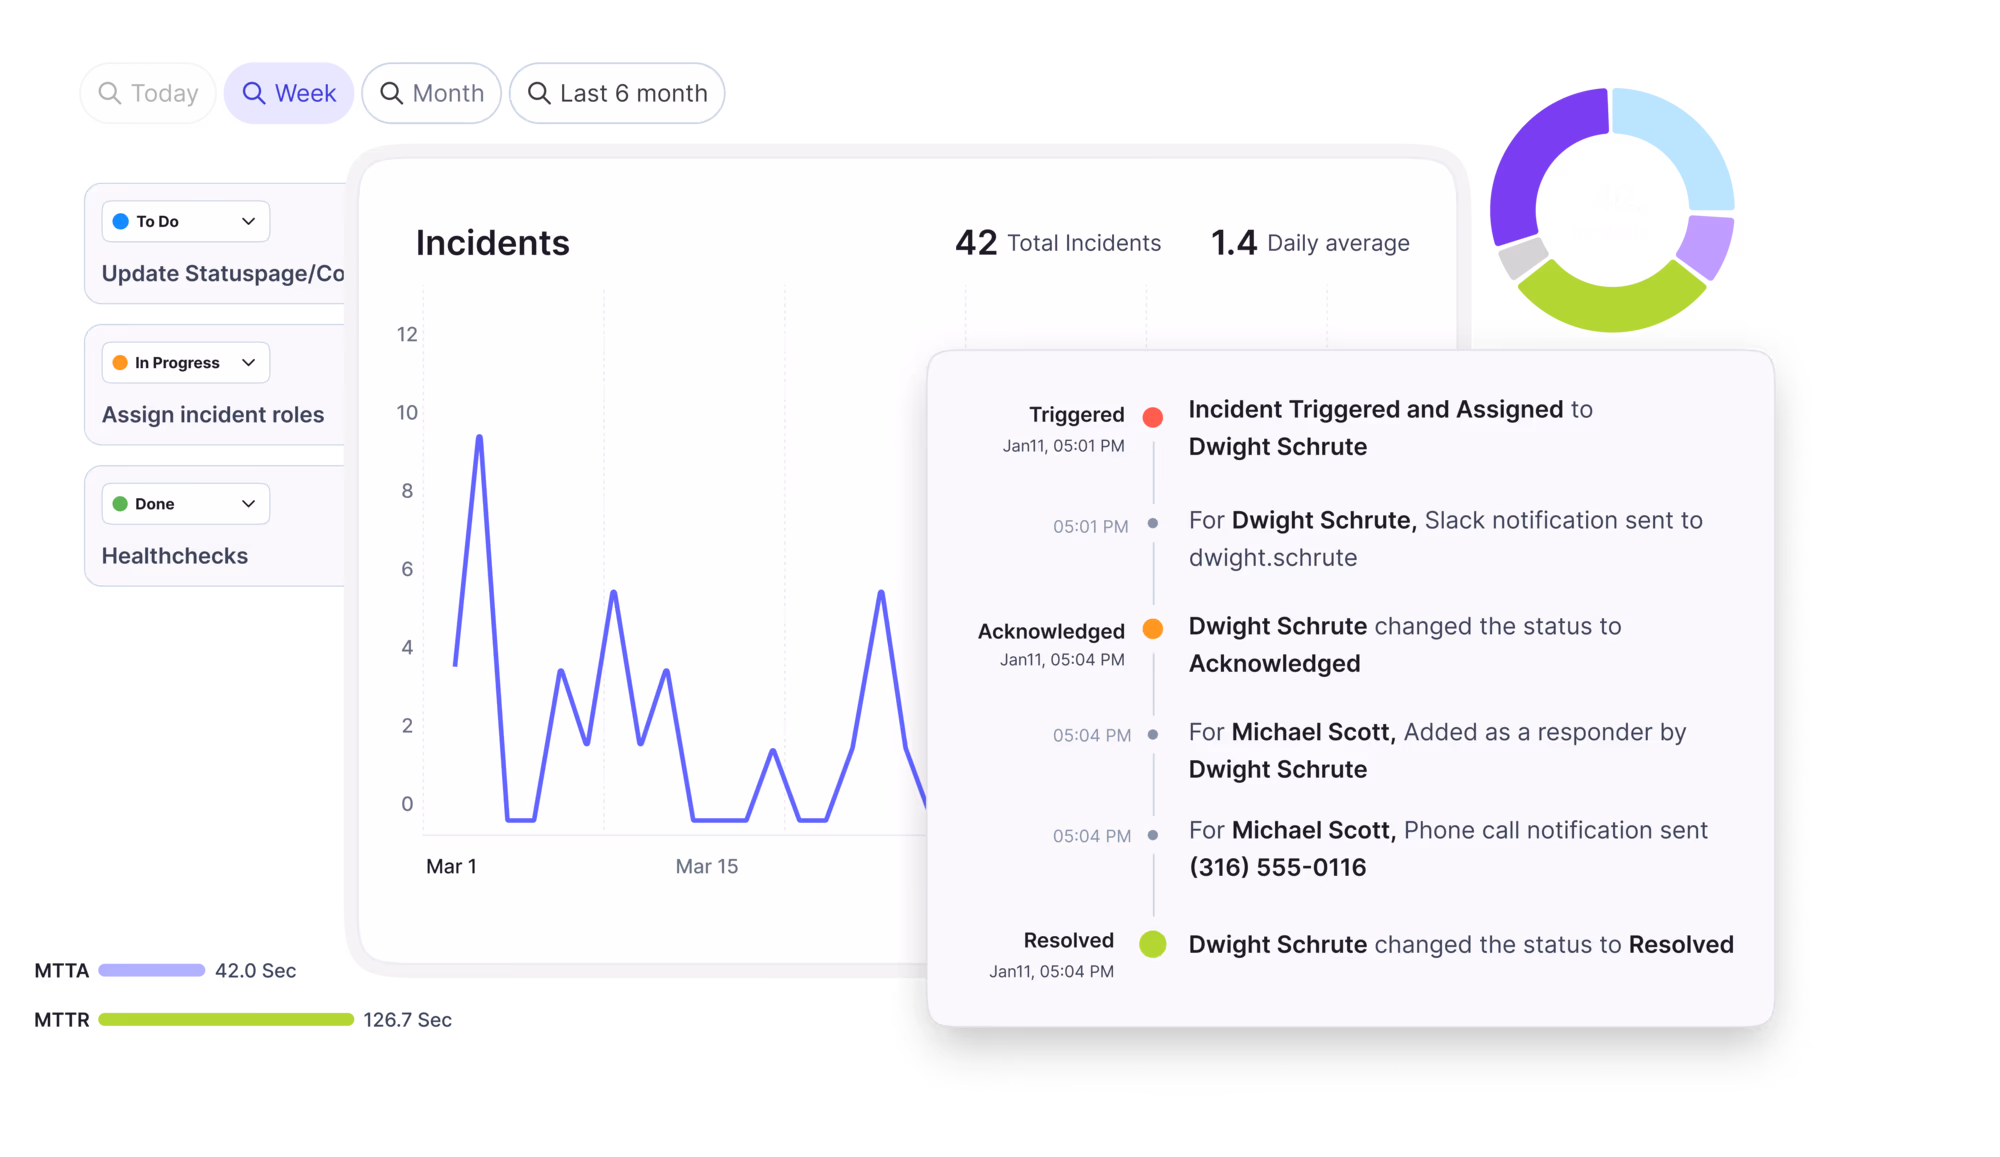
Learn how organizations have reduced downtime, improved 50% MTTA & MTTR, and cut costs with Xurrent IMR.
Discover Xurrent IMR's quick support, bidirectional integrations with Jira and Slack, and more cohesive incident response capabilities compared to Opsgenie.
Understand why users value Xurrent IMR for its intuitive interface, efficient incident alerting, customizable On-call schedules, and escalations.

The table below lists the fields of the Service Insight Dashboard and provides utilization guidelines for each field.
The table below lists the fields of the Service Insight Dashboard and provides utilization guidelines for each field.
| Field Label | Utilization Guideline |
|---|---|
| Service Provider |
The Service Provider field is used to indicate the provider of the service.
|
| SLA Targets |
The SLA targets field is used to indicate whether the current month's SLA targets are met or breached.
|
| Current risk level |
The Current risk level field is used to indicate whether the current risk is none, low, medium or high.
|
| KPI - Past 12 Months | |
| Availability |
The monthly Availability is calculated as a percentage of the time that the service was not down during service hours.
|
| Reliability |
The monthly Reliability is calculated as the number of times that the service was unavailable for covered people compared to the agreed service level.
|
| Responses within target |
The monthly Responses within target is based on the number of affected SLAs where the SLA response target has been set in a given month. The percentage is calculated by dividing the number of affected SLAs where the response target has been met by the total number of affected SLAs with the actual response time set in the given month.
|
| Resolutions within target |
The monthly Resolutions within target is based on the number of affected SLAs where the SLA resolution target has been set in a given month. The percentage is calculated by dividing the number of affected SLAs where the resolution target has been met by the total number of affected SLAs with the actual resolution time set in the given month.
The graph includes the last 12 months, where the last month is the month to date.
|
| Customer Satisfaction | |
| Customer satisfaction | The percentage shown is the percentage of requests that received positive feedback in the previous plus the current month. |
| Satisfied |
The Satisfied link shows the resolutions with positive feedback. The cut-off date is based on the moment the feedback was given.
|
| Dissatisfied |
The Dissatisfied link shows the resolutions with negative feedback. The cut-off date is based on the moment the feedback was given.
|
| Response rate |
The Response rate link shows the percentage of resolutions that received feedback. The cut-off date is based on the moment the request was completed.
|
| User Experience | |
| User Experience | The user experience or customer service rating is calculated by taking the average of all completed survey responses in the 12 month period ending in the selected month. For the current month, the calculation includes today's completed responses. |
| Cost | |
| Cost | The cost bar graph shows the cost of expenses (dark blue) and time spent (light blue) over the last 13 months, where the last month is the current, incomplete month. |

.webp)
.webp)