.webp)
%20(1).webp)
Blog
Insights & updates from our experts
Resolve issues quickly with an AI-powered system that automates ticketing.

Resolve issues quickly with an AI-powered system that automates ticketing.

Resolve issues quickly with an AI-powered system that automates ticketing.

Resolve issues quickly with an AI-powered system that automates ticketing.
Resolve issues quickly with an AI-powered system that automates ticketing.

Resolve issues quickly with an AI-powered system that automates ticketing.

Simplify on-call scheduling, automate escalations, and reduce burnout.
Automate postmortems, AI summaries, and post-incident workflows
We're here to help

The integration with Atlassian Jira using the Xurrent Integration Service is

The integration with Atlassian Jira using the Xurrent Integration Service is

The integration with Atlassian Jira using the Xurrent Integration Service is

The integration with Atlassian Jira using the Xurrent Integration Service is

The integration with Atlassian Jira using the Xurrent Integration Service is

The integration with Atlassian Jira using the Xurrent Integration Service is

The integration with Atlassian Jira using the Xurrent Integration Service is

The integration with Atlassian Jira using the Xurrent Integration Service is
Resolve issues quickly with an AI-powered system that automates ticketing.
Resolve issues quickly with an AI-powered system that automates ticketing.
Simplify on-call scheduling, automate escalations, and reduce burnout.
Automate postmortems, AI summaries, and post-incident workflows
Resolve issues quickly with an AI-powered system that automates ticketing.
Resolve issues quickly with an AI-powered system that automates ticketing.
Resolve issues quickly with an AI-powered system that automates ticketing.
Resolve issues quickly with an AI-powered system that automates ticketing.

We are here to help 24/7

Connect with other Xurrent Users

Get insights and tips on how to get the most out of Xurrent

Apps, APIs, and updates

Xurrent service functionality
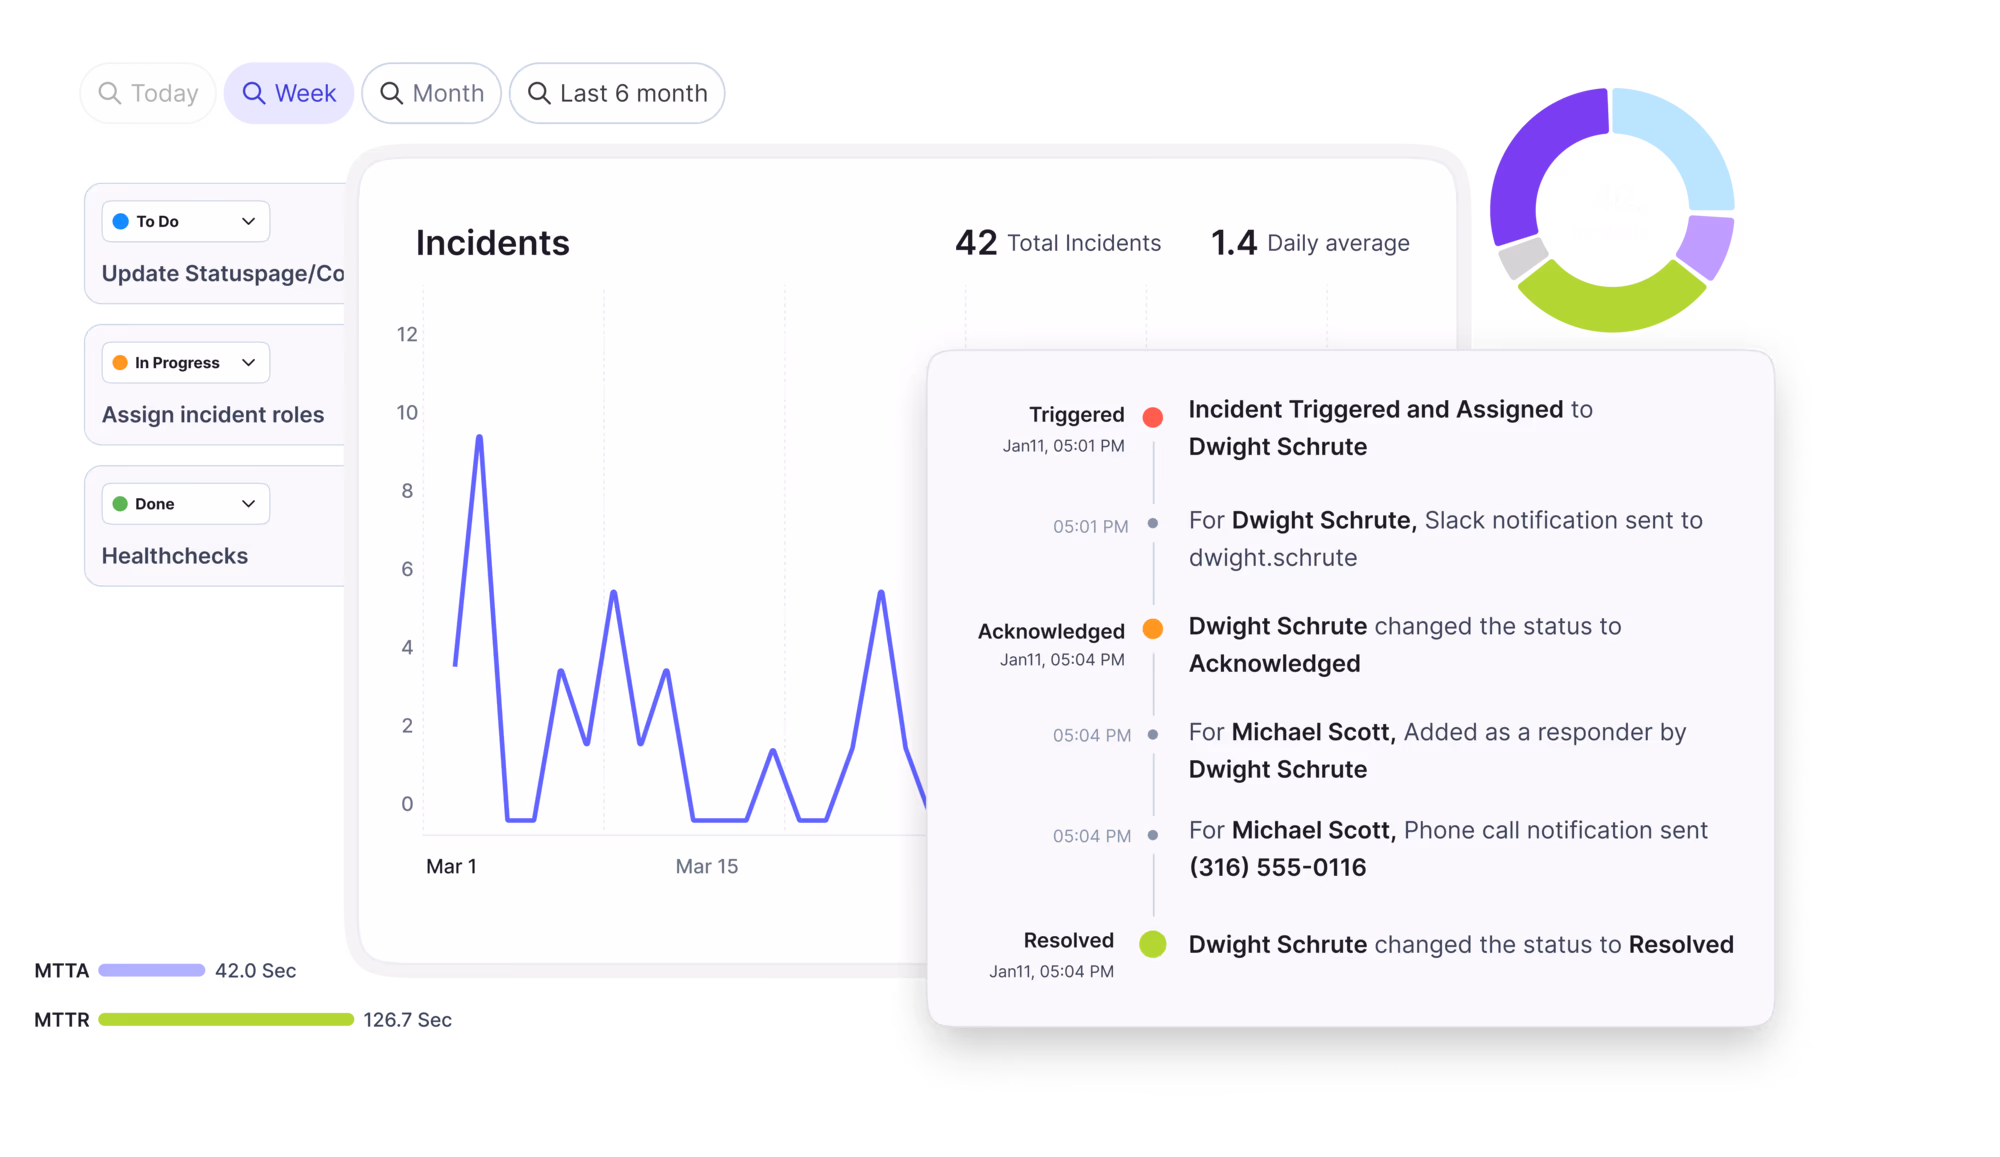
Eliminate manual tasks, optimize workflows, and deliver faster resolutions.
Learn how organizations have reduced downtime, improved 50% MTTA & MTTR, and cut costs with Xurrent IMR.
Discover Xurrent IMR's quick support, bidirectional integrations with Jira and Slack, and more cohesive incident response capabilities compared to Opsgenie.
Understand why users value Xurrent IMR for its intuitive interface, efficient incident alerting, customizable On-call schedules, and escalations.

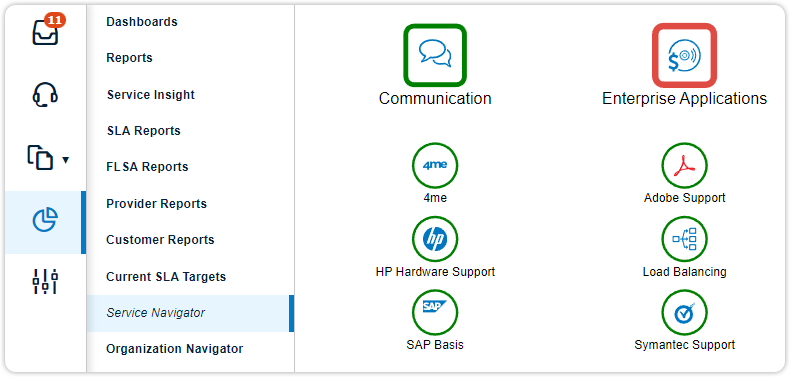
The Service Navigator, located in the Analytics console, provides an interactive graphical presentation of the dependencies between services and their constituents. By showing whether any of the service categories, services, service instances, or configuration items are down, it has at once become much more powerful.
Imagine that one of an organization’s servers has crashed, resulting in the creation of an incident with impact ‘Top’ (service down for several users). From the Service Navigator, this is now immediately clear. Any affected service categories and services are now displayed with a thicker red line, in this case ‘Enterprise Applications’.
After clicking on ‘Enterprise Applications’ it becomes clear which of the services of that category are affected. After selecting a service from that list, in this case ‘Expense Reporting’, details of the affected service instances are shown.
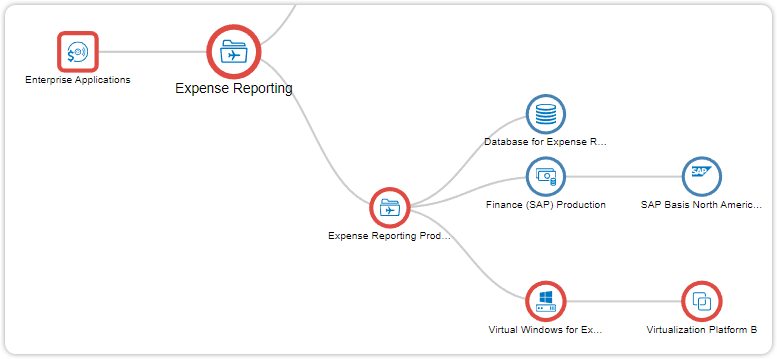
Following the line of affected service instances, in this case all the way to ‘Virtualization Platform B’, it becomes clear that the issue is with one of the server blades.
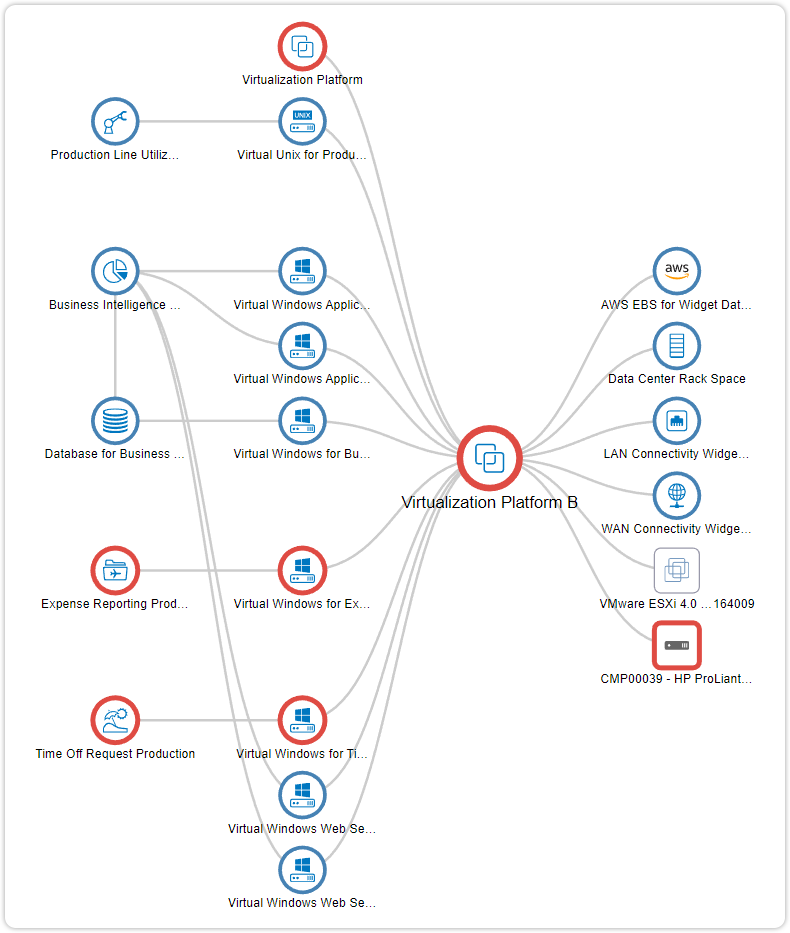
From here, it is immediately clear which services are impacted by the broken down configuration item. This is also the visualization that one gets when selecting ‘Service Navigator’ directly from Actions menu within the request. This enhancement was imagined and developed during the Xurrent Imagineering Days.
Most vendors will tell you ITSM implementation takes six months to a year — but modern, configuration-first platforms have rewritten the math entirely. See what real implementations look like in 2026, and why a long rollout is now a choice, not a given.


.webp)