.webp)


Blog
Insights & updates from our experts
Resolve issues quickly with an AI-powered system that automates ticketing.

Resolve issues quickly with an AI-powered system that automates ticketing.

Resolve issues quickly with an AI-powered system that automates ticketing.

Resolve issues quickly with an AI-powered system that automates ticketing.
Resolve issues quickly with an AI-powered system that automates ticketing.

Resolve issues quickly with an AI-powered system that automates ticketing.

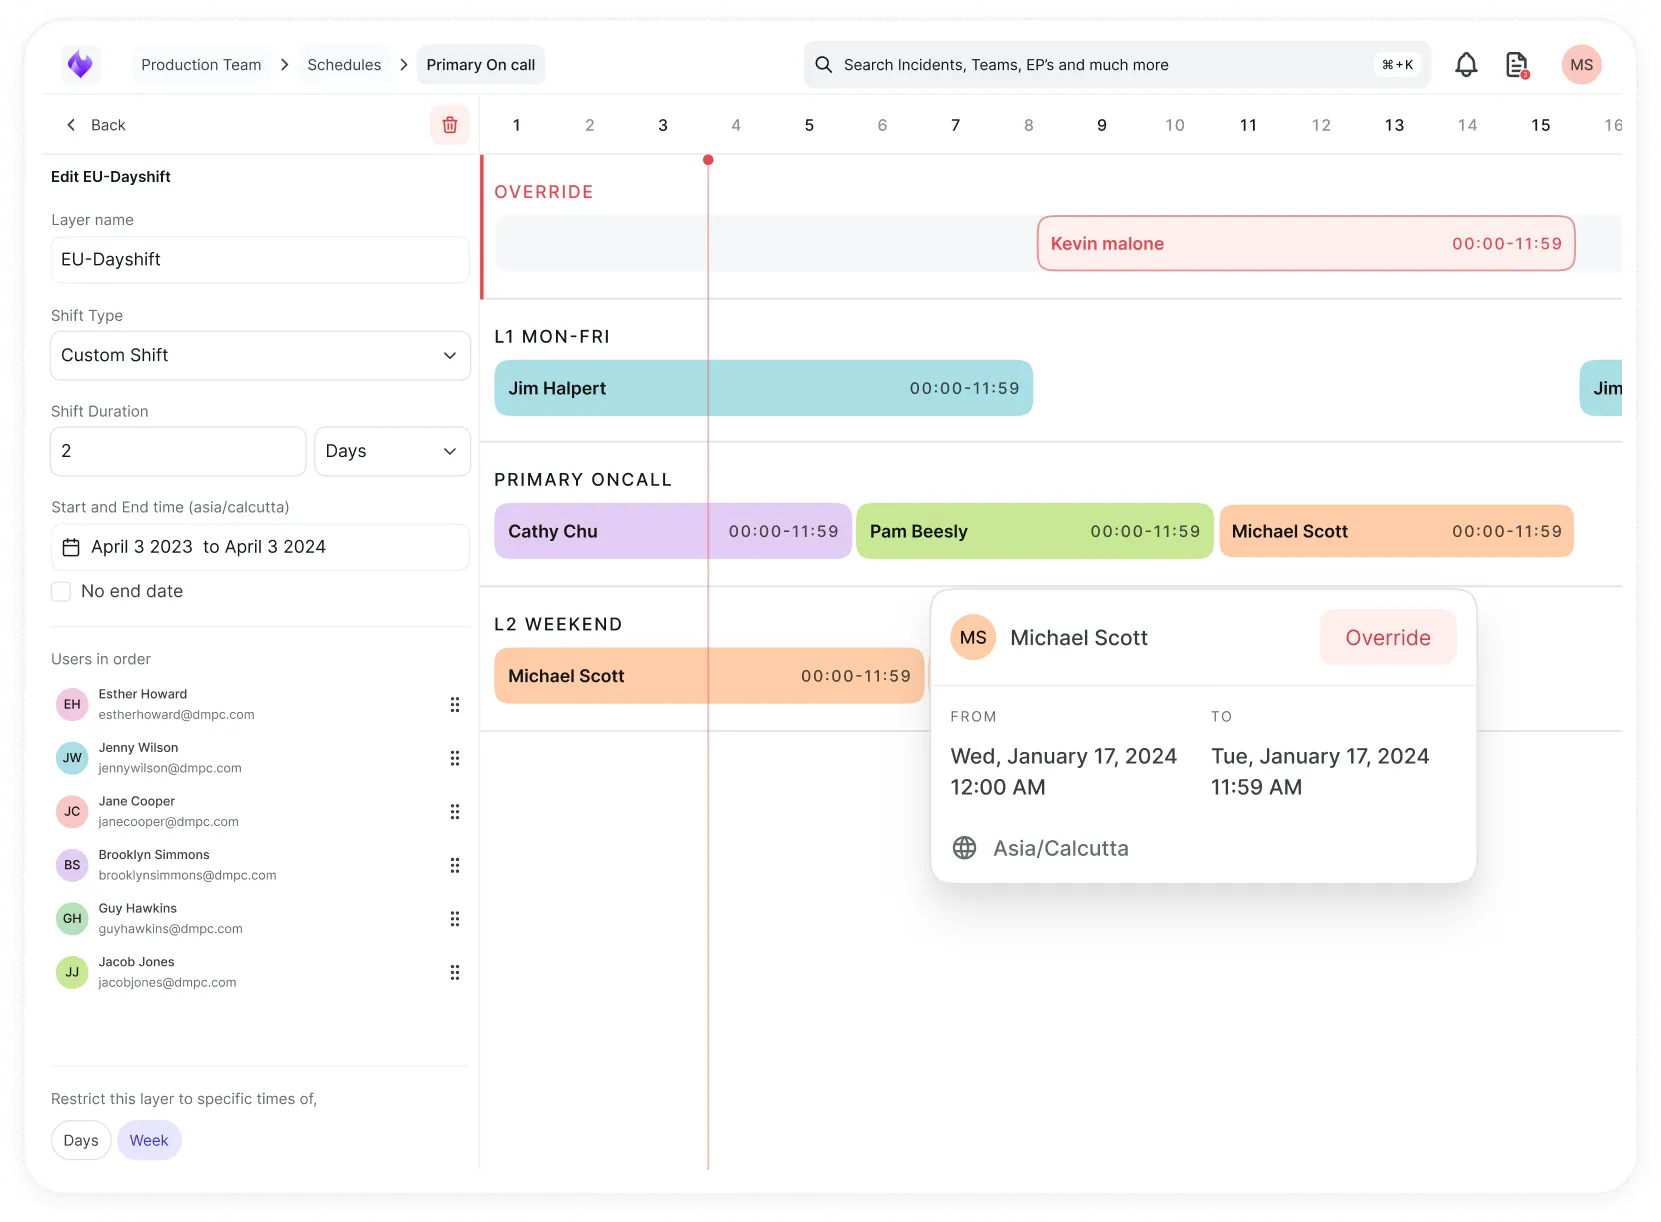
Simplify on-call scheduling, automate escalations, and reduce burnout.
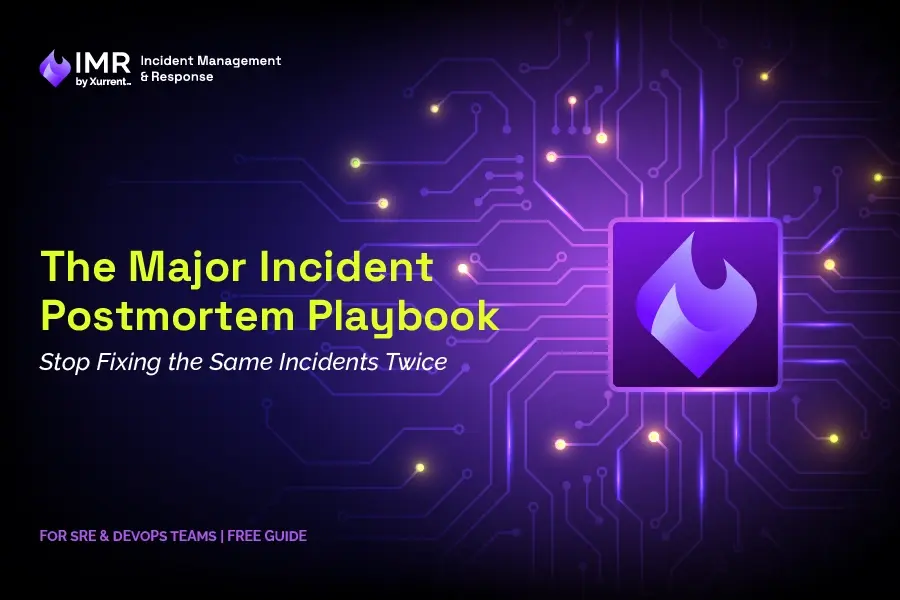
Automate postmortems, AI summaries, and post-incident workflows
We're here to help

The integration with Atlassian Jira using the Xurrent Integration Service is

The integration with Atlassian Jira using the Xurrent Integration Service is

The integration with Atlassian Jira using the Xurrent Integration Service is

The integration with Atlassian Jira using the Xurrent Integration Service is

The integration with Atlassian Jira using the Xurrent Integration Service is

The integration with Atlassian Jira using the Xurrent Integration Service is

The integration with Atlassian Jira using the Xurrent Integration Service is

The integration with Atlassian Jira using the Xurrent Integration Service is
Resolve issues quickly with an AI-powered system that automates ticketing.
Resolve issues quickly with an AI-powered system that automates ticketing.
Simplify on-call scheduling, automate escalations, and reduce burnout.
Automate postmortems, AI summaries, and post-incident workflows
Resolve issues quickly with an AI-powered system that automates ticketing.
Resolve issues quickly with an AI-powered system that automates ticketing.
Resolve issues quickly with an AI-powered system that automates ticketing.
Resolve issues quickly with an AI-powered system that automates ticketing.

We are here to help 24/7

Connect with other Xurrent Users

Get insights and tips on how to get the most out of Xurrent

Apps, APIs, and updates

Xurrent service functionality
Eliminate manual tasks, optimize workflows, and deliver faster resolutions.
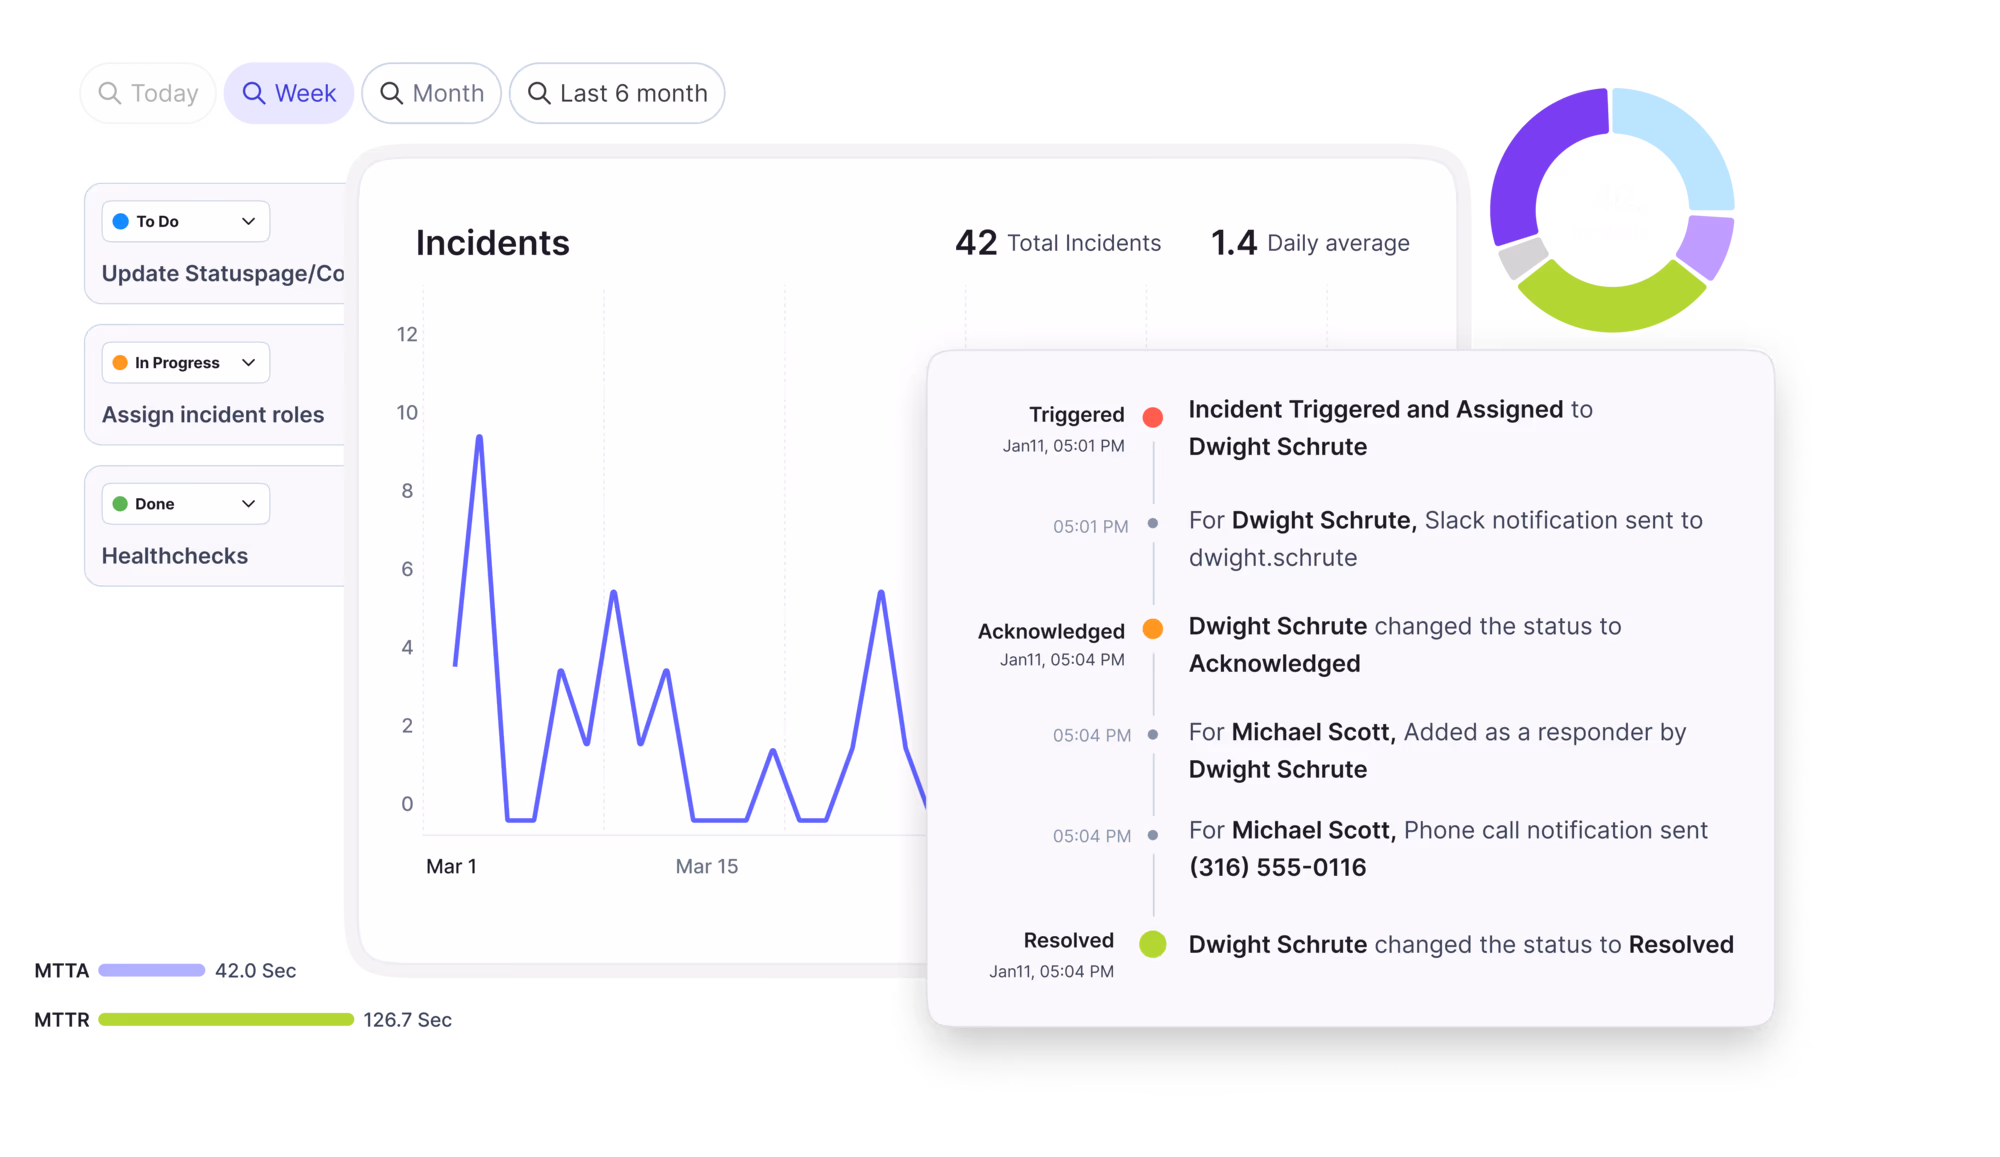
Learn how organizations have reduced downtime, improved 50% MTTA & MTTR, and cut costs with Xurrent IMR.
Discover Xurrent IMR's quick support, bidirectional integrations with Jira and Slack, and more cohesive incident response capabilities compared to Opsgenie.
Understand why users value Xurrent IMR for its intuitive interface, efficient incident alerting, customizable On-call schedules, and escalations.
Prometheus is an open-source monitoring solution that resides locally on your machine.
With Prometheus's Integration, Xurrent IMR sends new Prometheus alerts to the right team and notifies them based on on-call schedules via email, text messages(SMS), phone calls(Voice), Slack, Microsoft Teams and iOS & Android push notifications, and escalates alerts until the alert is acknowledged or closed. Xurrent IMR provides your NOC, SRE and application engineers with detailed context around the Prometheus alert along with playbooks and a complete incident command framework to triage, remediate and resolve incidents with speed.
Whenever Prometheus alert rule condition is triggered, an alert is created in Xurrent IMR, which creates an incident. When that condition goes back to normal levels, Xurrent IMR will auto-resolve the incident.
You can also use Alert Rules to custom route specific Prometheus alerts to specific users, teams or escalation policies, write suppression rules, auto add notes, responders and incident tasks.
run prometheus: ./prometheus --config.file=prometheus.ymlrun alertmanager: ./alertmanager --config.file=alertmanager.yml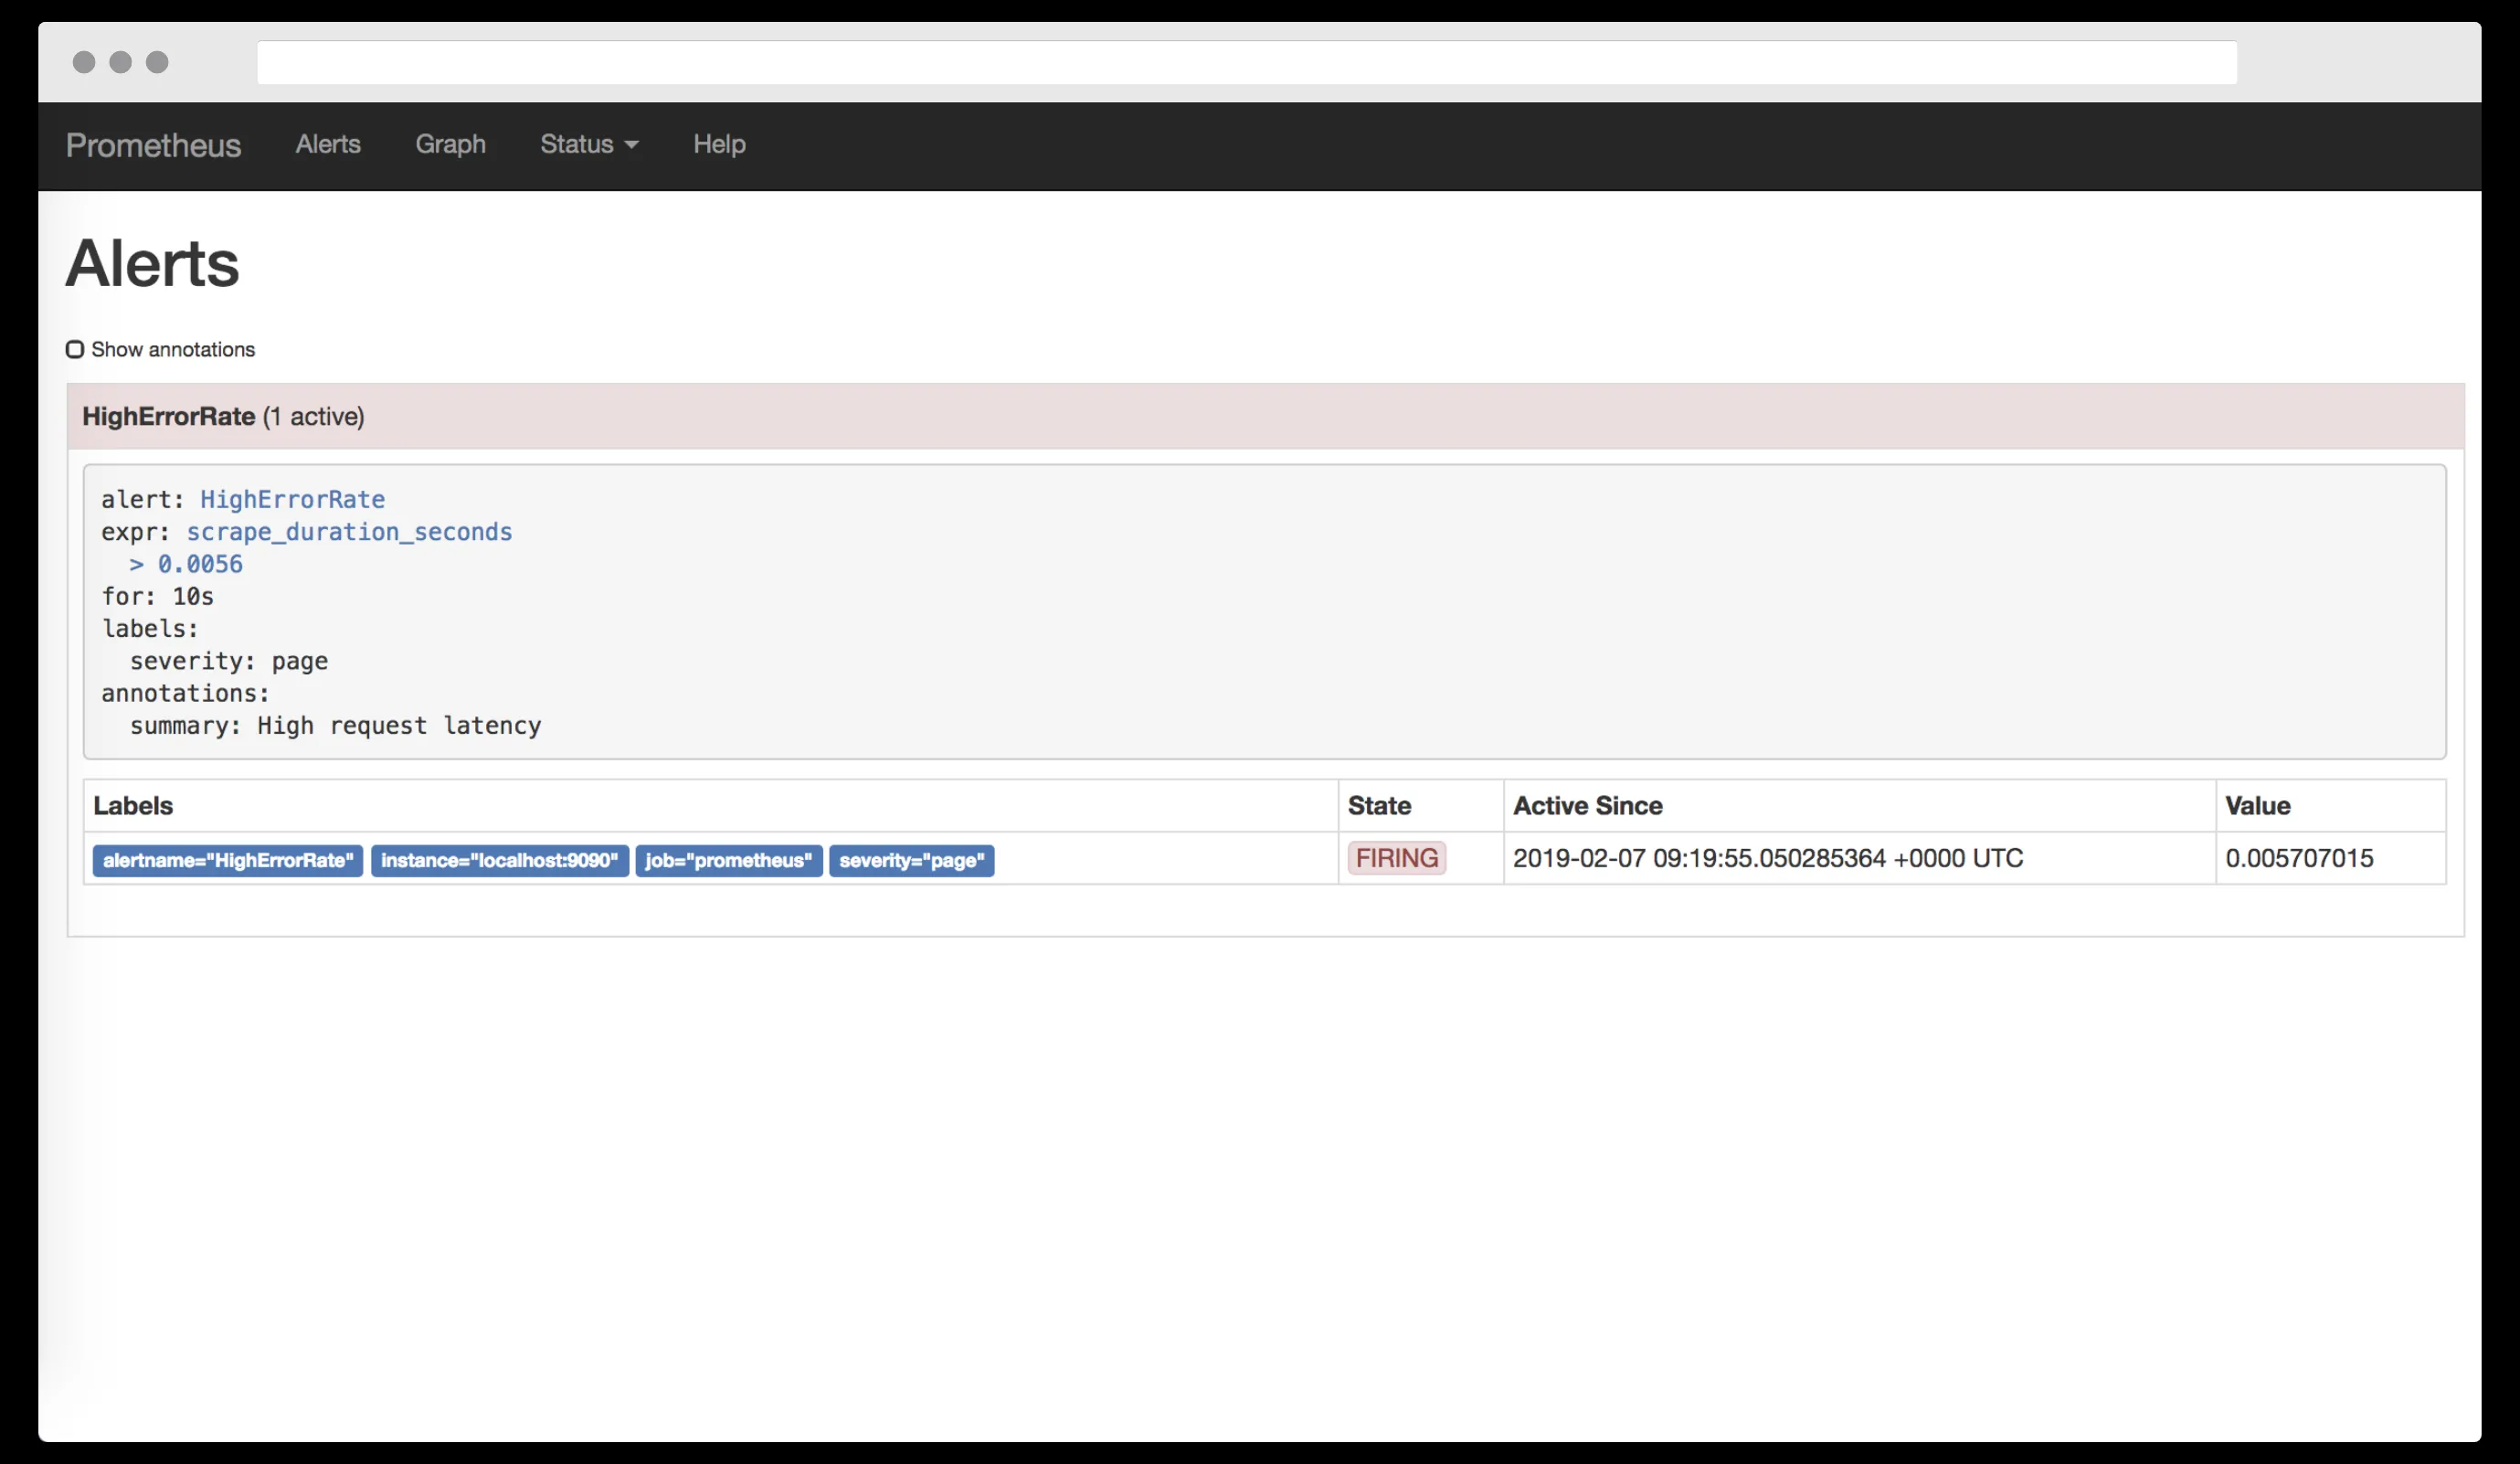
In order to scrape data from the multiple services or pods, one has to write custom scraping rules on Prometheus. Refer to the example below.
In the above example, scrape_configs defines the location from where the data needs to be scraped, which in this case is the kubernetes apiserver. You can define multiple jobs to scrape data from different services or pods. For Prometheus scraping, you need to define prometheus.io/scrape: 'true', prometheus.io/port: '9100' within the annotations section for the service or pod.
/etc/prometheus/prometheus.rules is the location of the Prometheus rule file, an example of which is shown below:
In the above example, the different resource related partitions are defined in groups and these groups have different rules for alerting. You need to make sure that you add the appropriate labels in your rules because Xurrent IMR will be matching these labels in the Alertmanager settings.
Now if the rule breaks and Prometheus sends it to the Alertmanager, then alertmanger must have the appropriate channel to notify. For configurating Alertmanager with Xurrent IMR or Slack, please see the below example:
One can add proxy in global settings if needed, like the snippet below.
For more information, visit the Alertmanager docs here


.webp)
.webp)