.webp)


Blog
Insights & updates from our experts
Resolve issues quickly with an AI-powered system that automates ticketing.

Resolve issues quickly with an AI-powered system that automates ticketing.

Resolve issues quickly with an AI-powered system that automates ticketing.

Resolve issues quickly with an AI-powered system that automates ticketing.
Resolve issues quickly with an AI-powered system that automates ticketing.

Resolve issues quickly with an AI-powered system that automates ticketing.

Simplify on-call scheduling, automate escalations, and reduce burnout.
Automate postmortems, AI summaries, and post-incident workflows
We're here to help

The integration with Atlassian Jira using the Xurrent Integration Service is

The integration with Atlassian Jira using the Xurrent Integration Service is

The integration with Atlassian Jira using the Xurrent Integration Service is

The integration with Atlassian Jira using the Xurrent Integration Service is

The integration with Atlassian Jira using the Xurrent Integration Service is

The integration with Atlassian Jira using the Xurrent Integration Service is

The integration with Atlassian Jira using the Xurrent Integration Service is

The integration with Atlassian Jira using the Xurrent Integration Service is
Resolve issues quickly with an AI-powered system that automates ticketing.
Resolve issues quickly with an AI-powered system that automates ticketing.
Simplify on-call scheduling, automate escalations, and reduce burnout.
Automate postmortems, AI summaries, and post-incident workflows
Resolve issues quickly with an AI-powered system that automates ticketing.
Resolve issues quickly with an AI-powered system that automates ticketing.
Resolve issues quickly with an AI-powered system that automates ticketing.
Resolve issues quickly with an AI-powered system that automates ticketing.

We are here to help 24/7

Connect with other Xurrent Users

Get insights and tips on how to get the most out of Xurrent

Apps, APIs, and updates

Xurrent service functionality
Eliminate manual tasks, optimize workflows, and deliver faster resolutions.
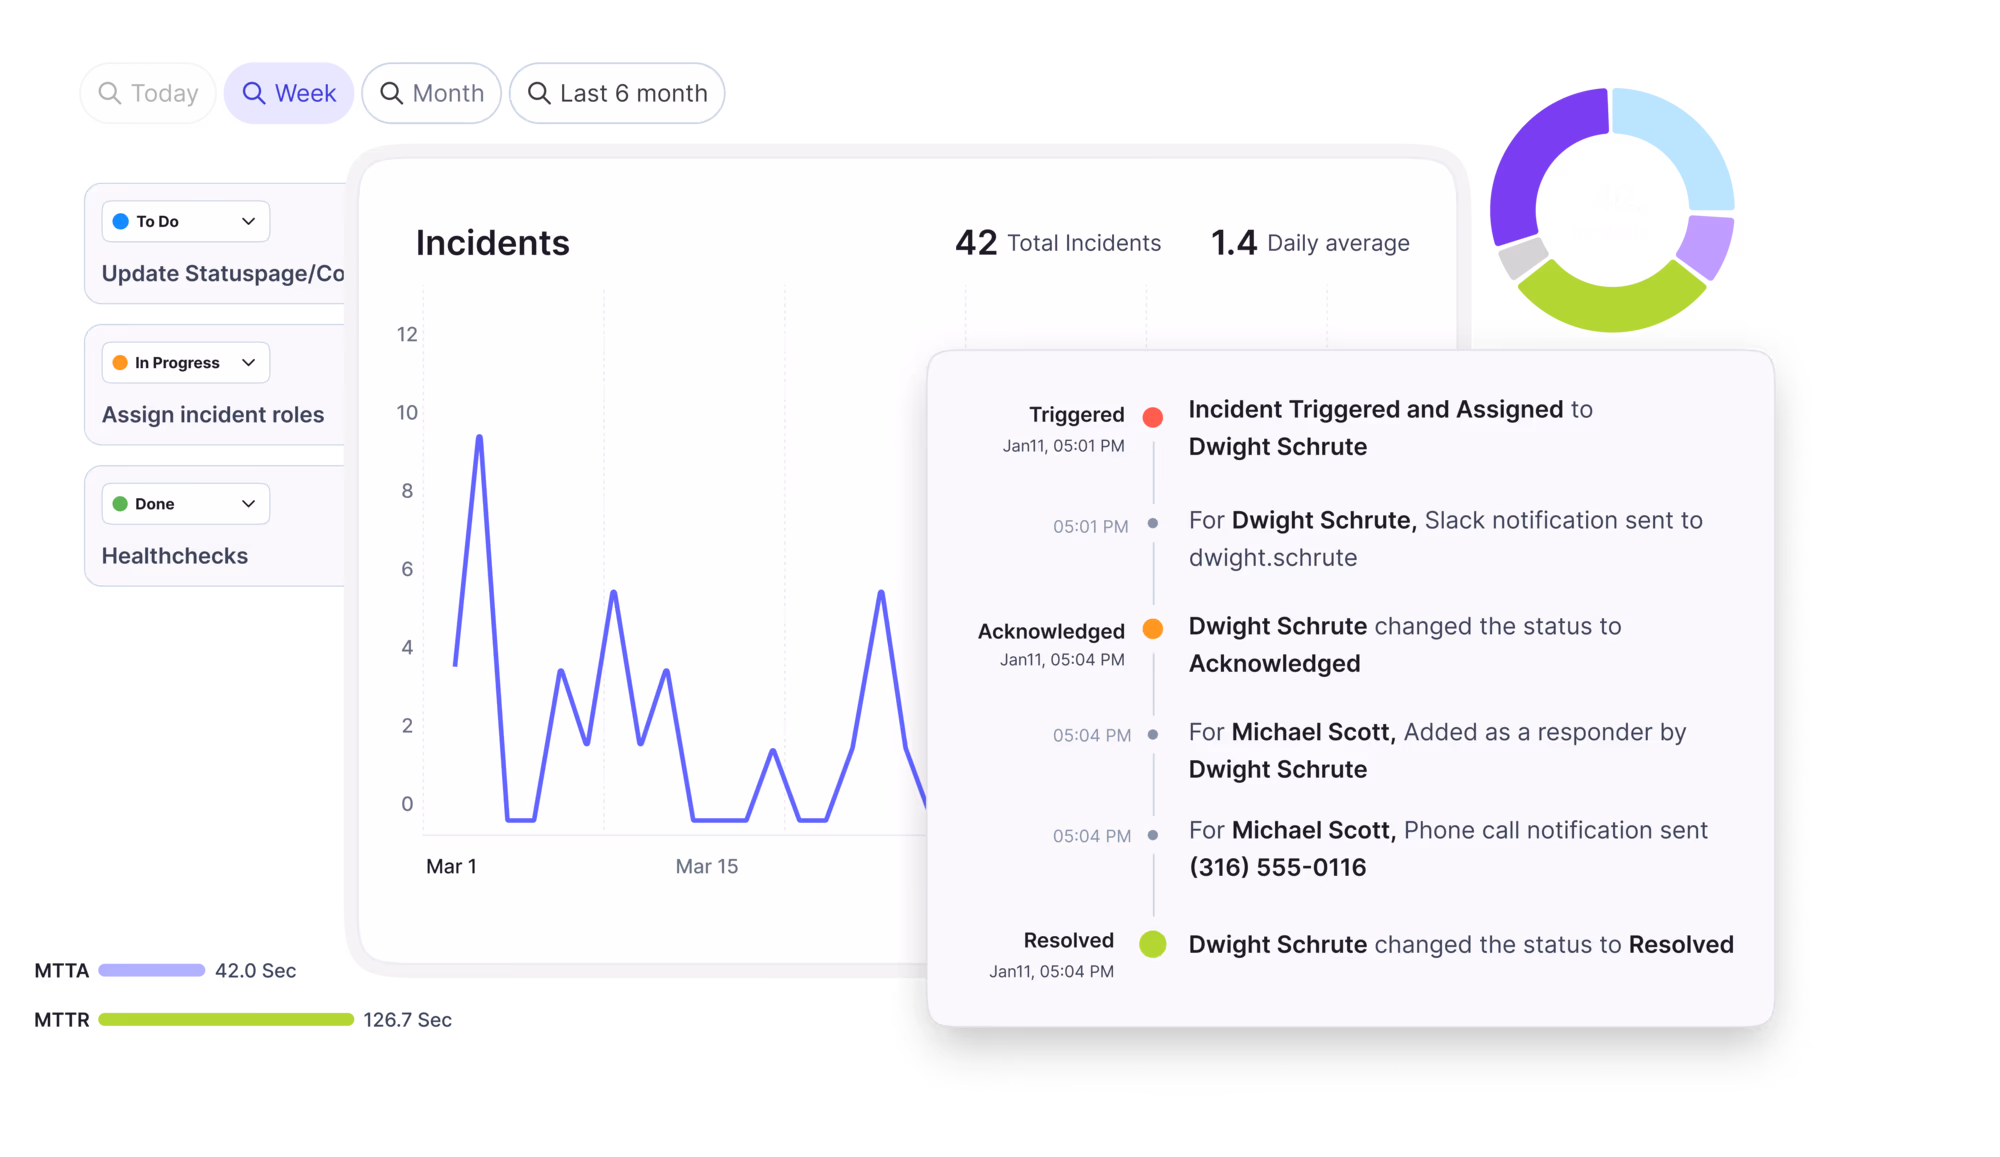
Learn how organizations have reduced downtime, improved 50% MTTA & MTTR, and cut costs with Xurrent IMR.
Discover Xurrent IMR's quick support, bidirectional integrations with Jira and Slack, and more cohesive incident response capabilities compared to Opsgenie.
Understand why users value Xurrent IMR for its intuitive interface, efficient incident alerting, customizable On-call schedules, and escalations.
The ‘Service Insight’ section has been added to the Analytics console. Service Insight provides an overall picture of an organization’s service landscape. Intended mainly for senior management, it provides the user with a dashboard for each of the organization’s services at a glance, including SLA trends, customer satisfaction, user ratings, cost, and compliance risks.
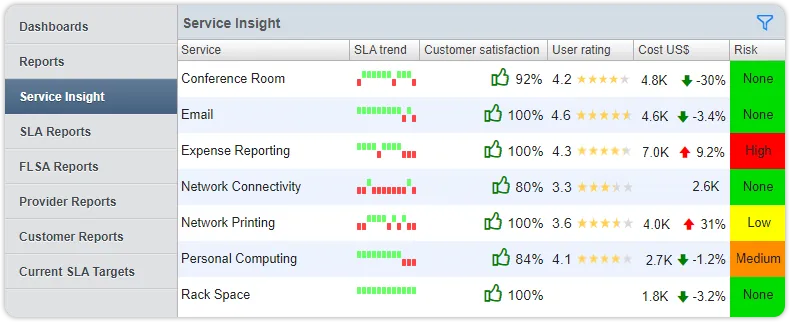
In this overview, the SLA trend shows whether the Key Performance Indicators (Availability, Reliability, Responses within target and Resolutions within target) have been met or breached for a service over the last 12 months. Customer satisfaction shows the percentage of users who positively responded to the inquiry about the handling of their request, while the user rating shows the user experience of the service, measured by the surveys that were filled in by users of that service. The ‘Cost’ column presents the costs that were incurred for the service in the previous month, accompanied by an indication whether those costs went up or down compared to the previous month, and how much. The ‘Risk’ column, finally, shows whether there are currently any risks related to a service, which is something the organization’s compliance officer will be interested in.
Selecting any of the services in this view will take the user to the dashboard for that specific service. The example below is that of the Personal Computing service.

In these service dashboards, users can drill down in most of the data representations. The ‘SLA targets’ link will show the SLAs that have been violated (or met) in the previous month and clicking on ‘Current risk level’ will show the risks that are open for the service.
From the ‘Customer Satisfaction’ section, the user can immediately review all requests of which the handling was considered satisfactory or unsatisfactory. The blue bars next to the ‘User Experience’ section are clickable and lead to the individual ratings for any of the 11 previous months or the current month.
The ‘Cost’ section is only visible to a person with the Financial Manager or Auditor role and presents the cost for the service per calendar month, made up of time spent and expenses. Clicking on the light blue part of a graph will take the user to the time entries for that service over the selected month, and clicking on the dark blue part of the graph will take the user to the expenses for that service over the selected month.


.webp)
.webp)