

Blog
Insights & updates from our experts
Resolve issues quickly with an AI-powered system that automates ticketing.

Resolve issues quickly with an AI-powered system that automates ticketing.

Resolve issues quickly with an AI-powered system that automates ticketing.

Resolve issues quickly with an AI-powered system that automates ticketing.
We're here to help

The integration with Atlassian Jira using the Xurrent Integration Service is

The integration with Atlassian Jira using the Xurrent Integration Service is

The integration with Atlassian Jira using the Xurrent Integration Service is

The integration with Atlassian Jira using the Xurrent Integration Service is

The integration with Atlassian Jira using the Xurrent Integration Service is

The integration with Atlassian Jira using the Xurrent Integration Service is

The integration with Atlassian Jira using the Xurrent Integration Service is

The integration with Atlassian Jira using the Xurrent Integration Service is
Resolve issues quickly with an AI-powered system that automates ticketing.
Resolve issues quickly with an AI-powered system that automates ticketing.
Resolve issues quickly with an AI-powered system that automates ticketing.
Resolve issues quickly with an AI-powered system that automates ticketing.

We are here to help 24/7

Connect with other Xurrent Users

Get insights and tips on how to get the most out of Xurrent

Apps, APIs, and updates

Xurrent service functionality
Eliminate manual tasks, optimize workflows, and deliver faster resolutions.
Learn how organizations have reduced downtime, improved 50% MTTA & MTTR, and cut costs with Xurrent IMR.
Discover Xurrent IMR's quick support, bidirectional integrations with Jira and Slack, and more cohesive incident response capabilities compared to Opsgenie.
Understand why users value Xurrent IMR for its intuitive interface, efficient incident alerting, customizable On-call schedules, and escalations.

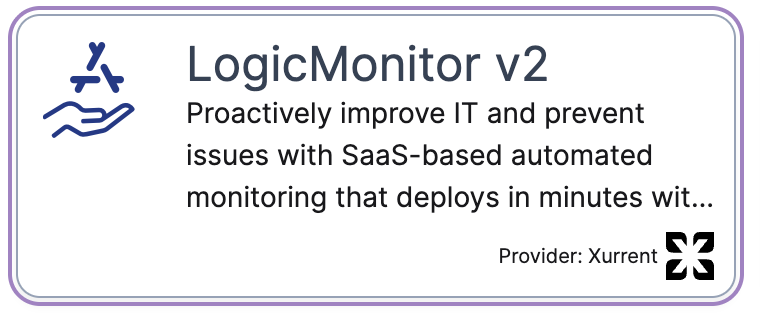
This guide explains how to install and configure the LogicMonitor v2 app in Xurrent to automate ticket creation, synchronize alerts, and enable webhook-based integration.
It covers two main sections:
1. Installing the LogicMonitor v2 App in Xurrent – How to add the LogicMonitor v2 app and provide the necessary configuration details.
2. Configuring Integration in LogicMonitor – How to set up the Webhook-based integration and validate connectivity.
1. Installing the LogicMonitor v2 App in Xurrent
1. Open the Xurrent App Store and locate the LogicMonitor v2 app.
2. During installation, provide the following configuration details:
Service Name:
Enter the name of a service instance created in Xurrent (e.g., “LogicMonitor”).
This service instance will be used to route tickets from LogicMonitor to Xurrent.
A valid service instance is required for the integration to work.
Team Name:
To enable LogicMonitor V2 to automatically close requests in Xurrent when an alert is cleared in LogicMonitor, you need to link the appropriate team to the LogicMonitor V2 member in OAuth Applications. This ensures that LogicMonitor V2 is part of your team and has the necessary permissions to close requests on its behalf
Follow these steps:
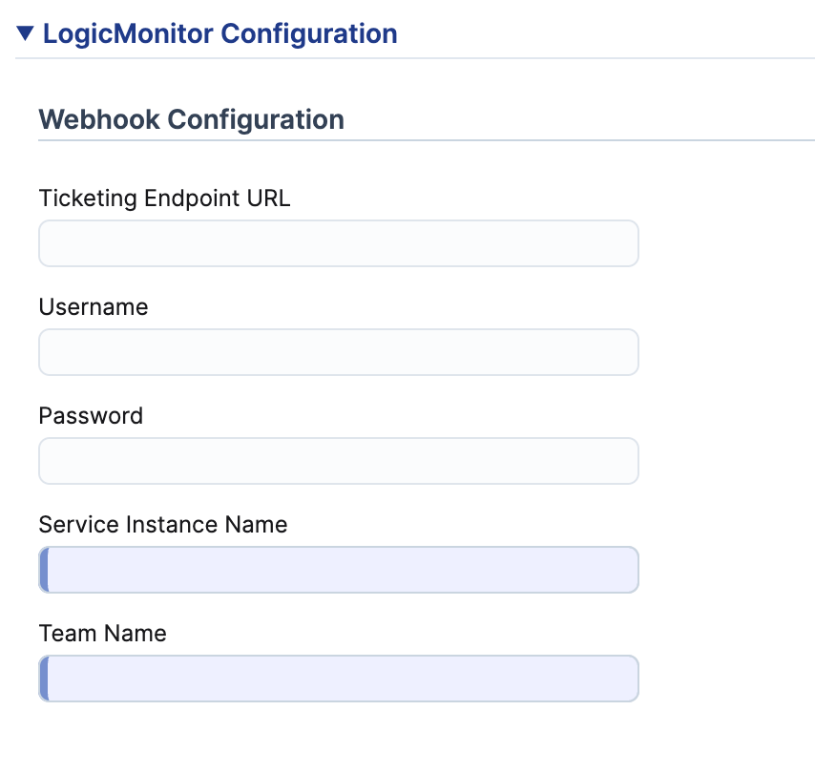
Note : By default, both the Service instance name and Team name will be used, but they can be overridden if the LogicMonitor webhook payload provides a different service_instance_node_id, team_node_id, and/or member_node_id.
Save the app. The app will generate integration details required for LogicMonitor.
If the details do not appear immediately, refresh the screen.
If the details are still missing after one minute, contact Xurrent support or try reinstalling the app.

Note: Ensure the configuration values shown match your account. Do not copy values from screenshots, as user names or passwords may differ.
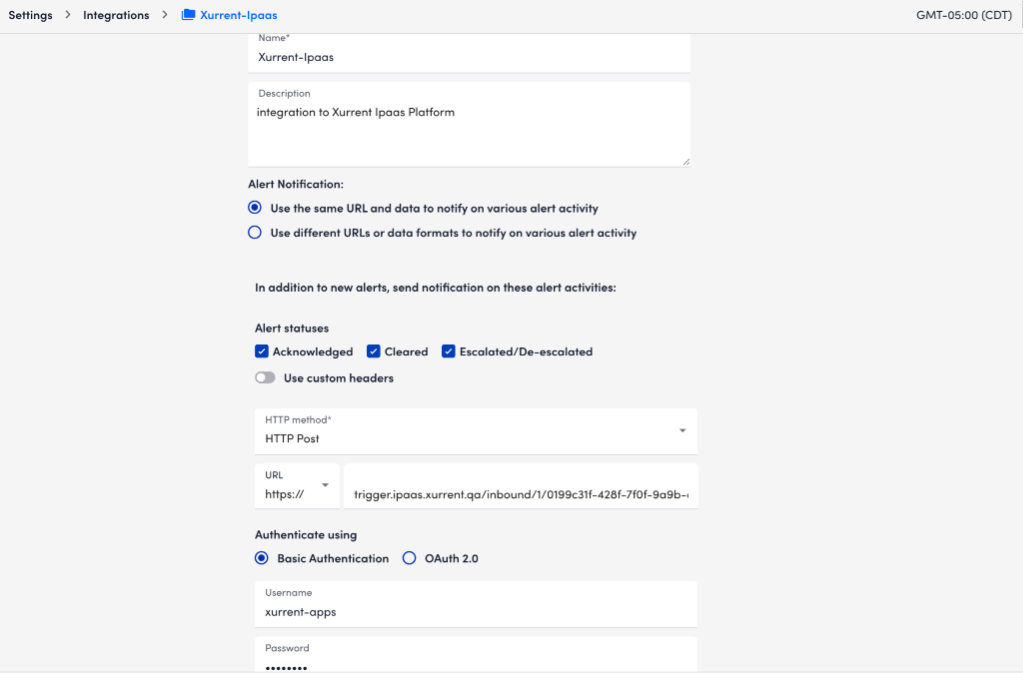
2. Configuring Integration in LogicMonitor : Login to your logicmonitor app
Alert statuses: Cleared (mandatory); optionally Acknowledged and Escalated/De-escalated.

To streamline the configuration process and eliminate the need for an additional mapping model, all settings can be directly provided via the alert data.
Within the LogicMonitor integration you need to specify the payload. This example payload shows all mandatory fields. (copy this json and paste the it while configuring in Logic Monitor)
{
  "alert_id": "##ALERTID##",
  "alert_message": "##MESSAGE##",
  "alert_level": "##LEVEL##",
  "alert_type": "##ALERTTYPE##",
  "alert_status": "##ALERTSTATUS##"
}
Additionally, you can also choose to override default values that are used to create the request by adding those respective fields in the payload. Refer below to see how you can override those fields.
i.e. The request in xurrent will be created and have a note "Status: warn", you can override this by having "subject": "Overridden subject" in the payload.
FYI: All such fields (optional) are to be passed inside the field data as shown below
{
  "alert_id": "##ALERTID##",
  "alert_message": "##MESSAGE##",
  "alert_level": "##LEVEL##",
  "alert_type": "##ALERTTYPE##",
  "alert_status": "##ALERTSTATUS##",
  "data": {
    "request_template_node_id": "TEMPLATE ID",
    "service_instance_node_id": "SERVICE INSTANCE ID",
    "team_node_id": "TEAM NODE ID",
    "member_node_id": "MEMBER NODE ID",
    "subject": "Test Subject",
    "note": "Test note",
    "tags": [
      "test_tag1",
      "test_tag2"
    ],
    "custom_fields": {
      "ci": "device"
    }
  }
}
All logicmonitor supported fields added below : https://www.logicmonitor.com/support/logicmodules/about-logicmodules/tokens-available-in-logicmodule-alert-messages
Payload fields overview :
Note : When optional fields are included in the LogicMonitor payload, the default values will be overridden.
To Receive the webhook updates from above integration - we need to setup the Alert Rules & Escalation Chains in Logicmonitor
To setup the Alert rules :
https://www.logicmonitor.com/support/alert-rules
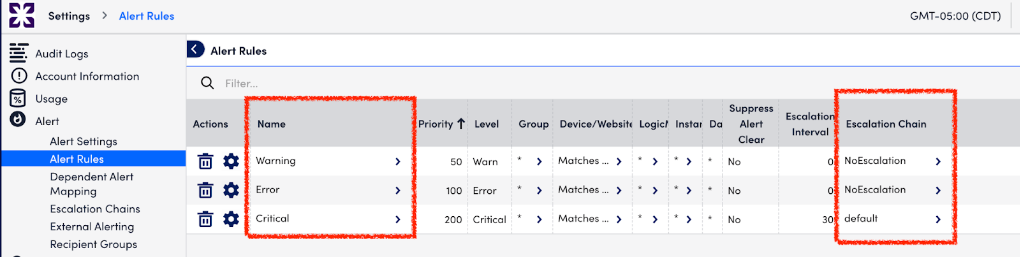
To setup Escalation Chains :
https://www.logicmonitor.com/support/escalation-chains
When adding stages, the previously configured integration will appear as a selectable contact method, as shown below.

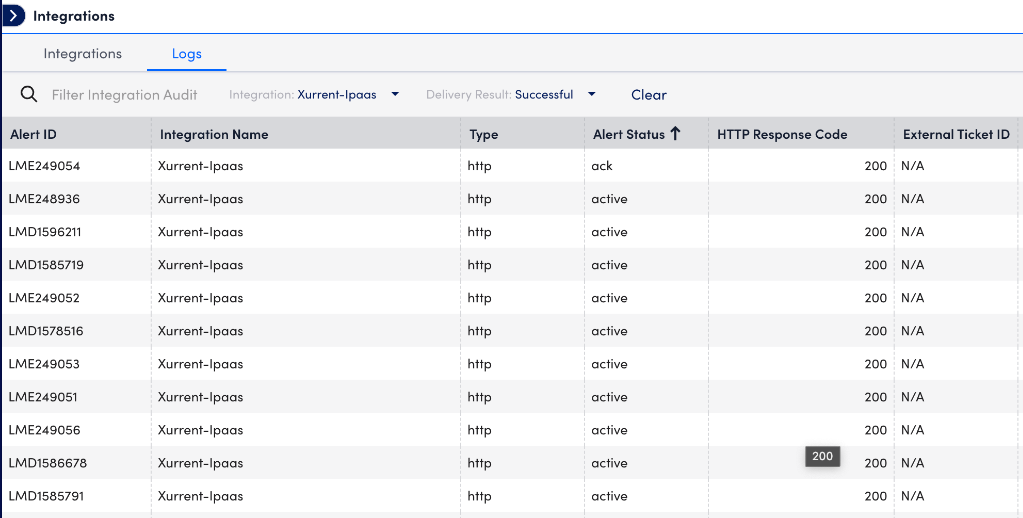
Integration Logs : Go to Settings → Integrations → Logs to check if any webhooks have been sent to the Xurrent system and to identify any errors or issues that may have occurred


.jpg)