Lock Report Filter on Dashboard
After a filter has been added to a dashboard, it is applied to all of the dashboard’s reports that allow this filter to be selected. In some cases, though, one of the reports may need the same filter, but this filter should be defined differently from the other reports of the dashboard. In such cases, the definition of the filter can be adjusted in this report, after which the filter is locked in the report to ensure that it does not get updated when its definition is updated at the dashboard level.
Locking a report’s filter is easy. Let’s use to following dashboard to explain how a report filter can be locked.
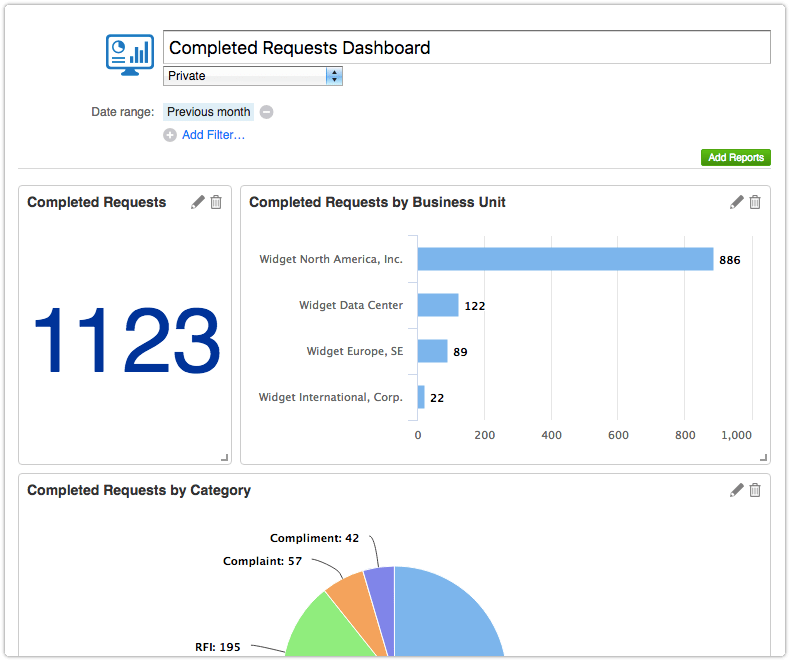
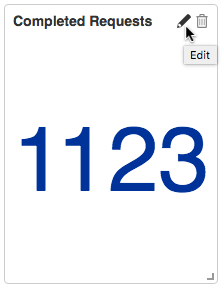
Assume that this dashboard needs to be adjusted so that it shows the number of requests that were completed today in its upper left corner.
To achieve this, first ensure that the dashboard is placed in Edit mode by pressing the toolbar button with the pencil icon above the dashboard. Next, place the metric report in the upper left corner of the dashboard in Edit mode by clicking on its small pencil icon.
This opens the metric report in a dialog that is positioned over the dashboard. In the report, the filter that was applied at the dashboard level is visible. A small open lock icon indicates that if the filter is updated at the dashboard level, it will also get updated in this report.
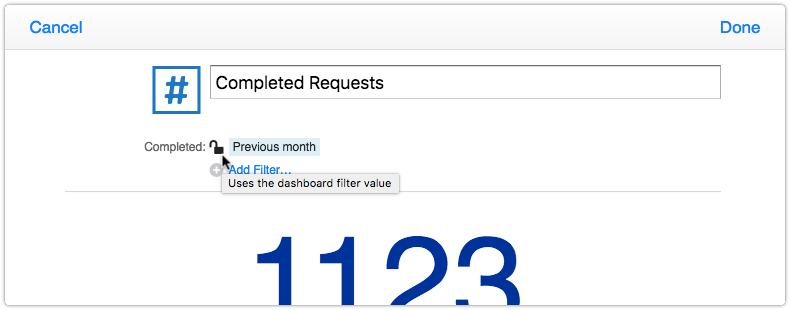
Changing the definition of the filter causes the icon to change into a closed lock. This indicates that the filter’s definition is different from how it is defined at the dashboard level and that this definition will not change when the filter is updated at the dashboard level. Whenever the filter of a specific report is defined differently at the dashboard level, it is best to point this out in the report’s name so that it is clear for the people who will use the dashboard.
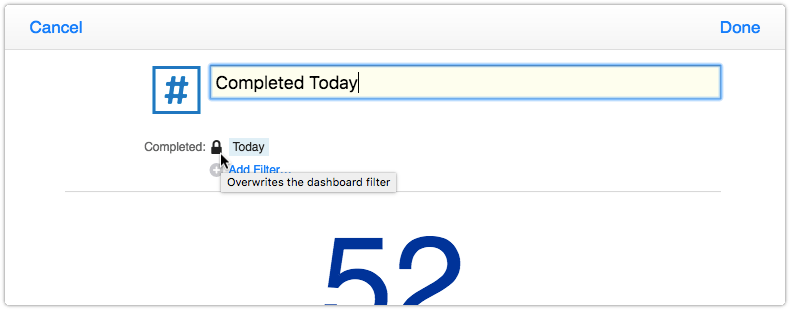
Once the filter has been adjusted and the name has been updated, the ‘Done’ option can be pressed to return to the dashboard.
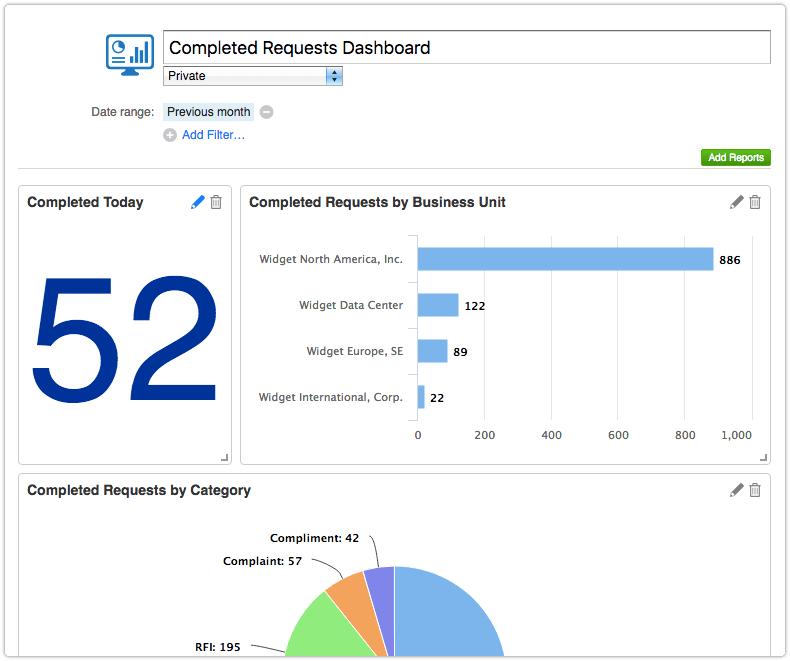
Note that the pencil icon of the metric report is now presented in blue to indicate its filters have been customized. When the dashboard is switched to View mode, it is the gray filter icon that warns people that the report has non-standard filters.
Note also that whenever a filter is applied or adjusted, the affected report (or reports, if the update was performed at the dashboard level) are immediately refreshed. There is no need to refresh the browser window manually.
