Blog
New Reports for Targets Met and Violated

In the ‘Reports’ section of the Analytics console, several reports can be found that present data about SLA targets that were either met or violated. To give organizations better insight into the specifics and numbers of requests that were responsible for breaching at least one affected SLA target, two new reports have been created:
- Request Response Targets Met and Violated
- Request Resolution Targets Met and Violated
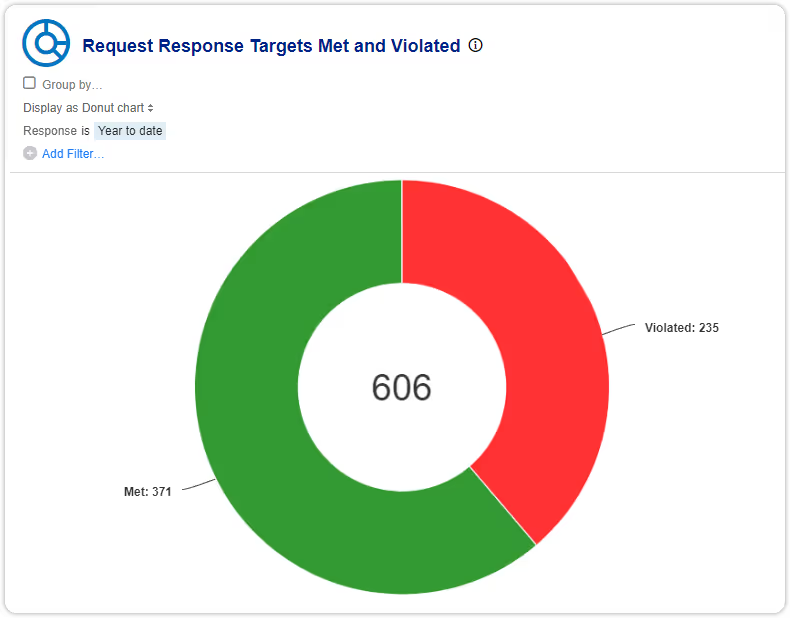
These reports can be presented as a pie, donut or bar chart and show the number of distinct requests that either met or violated an affected SLA.